Oil testing kit Blog
Ongoing design of compact cuvette frame
What I want to do
Continue spare-time development of a smaller, more stable and compact, multi-use cuvette frame attachment for the 3.0 Desktop Spectrometry Kit, summarized in a few previous posts by myself and @tonyc:
- https://publiclab.org/n/12561
- https://publiclab.org/n/12462
- https://publiclab.org/n/11063
- https://publiclab.org/n/12472
My attempt and results
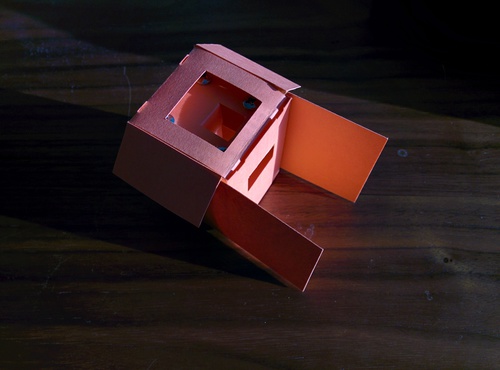
I developed a vector design for my Silhouette Cameo desktop paper cutter, trying to get it to fit on a letter-sized (8.5x11") sheet. I modified the design after printing and assembling it; see my modifications in the laid-out-flat photo below.


The internal part is made of two C-shaped folded pieces which bolt together using long bolts spaced out with 1/2" nylon tubes; one nice thing is that I believe the whole thing can be very precisely raised and lowered by turning the bolts; they hold on the cardstock. A final version might be made of a flexible plastic sheeting.
The two "wings" slot into the slots on the spectrometer, and index at all four corners. Because of the fold-over bottom and top, it's very sturdy. I put a hole on the back for where the knob for dimming the light will go -- remember, we're going to try to get this working with LEDs, and if not, maybe a laser diode component, dimmed with a dial.
The "stack" fits inside and is folded over with a big flap, like this:


Questions and next steps
I haven't added the extra flaps to the digital file yet, but they're pretty straightforward, and I'll update soon. And there are some sub-millimeter sizing issues on the "stack" -- and i also messed up one of the screw hole locations.
Then I'll need to try putting the electronics in. I'm going to try to screw the Arduino Trinket and the LED board directly to the paper enclosure.
Update: adjusted the digital file to match the modifications; still needs some work on sub-millimeter sizing and maybe flap locking: cuvette-frame-7.pdf (have to modify publiclab.org to accept dxf uploads)

Follow related tags:
spectrometer fluorescence cuvette oil-testing-kit

OTK Proto3
Preface
I received an early Beta OTK to assemble and test but found the mechanics of the device much too unstable to perform any real testing so I needed to prototype something more rigid. I also have been recently unable to use SWB for collecting data (Firefox or Chrome) so I also needed an alternate approach for observing the OTK's measurement capabilities.
I'd previously ( https://publiclab.org/notes/stoft/03-02-2015/plab-3-spectrometer-upgrade-prototype ) constructed a more rigid Version-3 of the PLab spectrometer so decided to continue with that mechanical design for integration into a more stable OTK. To avoid the SWB difficulties and retain more flexibility to experiment with data and plots, I wrote new webcam interface and plotting utilities using matlab.
Abstract
Oils derived by heat (cracking) from hydrocarbon compounds (crude oil) contain significant (yet quite variable) Polycyclic Aromatic Hydrocarbons (PAHs) which fluoresce under UV light (typically 300-400nm wavelengths). Webcam spectrometer based fluorescence measurements using a 405nm UV pocket laser can detect the presence of some oils as contaminants. However, the observations below suggest the detection threshold is in the 'ppt' (parts-per-thouand), not 'ppm' level. Such a high threshold prompts serious doubts about measuring contaminant trace amounts at levels where these chemicals, and their byproducts, become toxic.
Despite this limitation, detecting contaminants by UV fluorescence, at dilution levels below what is visually apparent to the eye, may still be useful. This is why it is important to know the measurement procedures, parameters and limits of this device. I hope the following designs and observations will be helpful.
Construction

To perform any reasonable comparison between fluorescence plots, the mechanics of the OTK must be very stable. This cannot be emphasized enough. As some Beta users have reported, the all-paper design requires very careful hand-holding just to get plots. I'd agree with that assessment as I found it impossible to acquire repeatable measurements using the Beta OTK.
So, I removed my PLab Proto3 spectrometer design from the PLab paper enclosure, added a solid end plate behind the webcam and then recovered with a new single-surface black paper over the light sensitive regions. This also makes the PLabP3 spectrometer a single, independent module; making it easy to separately calibrate for wavelength and gain before inserting into the OTK Proto3.
The OTK system need not be very light-tight (assuming a relatively low-ambient light environment -- i.e. turn off the overhead desk lamp when using the OTK). It is the PLab3 spectrometer module which needs to be very light-tight in order to keep the measurement noise to a minimum (which thus maximizes the measurement's dynamic range).
The OTK Proto3 construction material of choice was hard wood (maple) because it cuts cleanly, is mechanically stable, is easy to work with and scrap material was readily available. It is not necessarily the best option for volume production but is quite superior for prototype work where the purpose is to develop design concepts and identify measurement limits.
The addition of a "front-surface" mirror allows for a more compact "folded" mechanical design with the laser mounted in parallel with the spectrometer. Having the front surface of the mirror reflective is important because a "back surface" mirror would allow the mirror glass to interfere with the UV light; causing unwanted refraction and internal reflections as well as attenuating the UV signal

[ Note: As a quick first substitute, an aluminum foil reflector was prepared but even with care, that surface was not sufficiently polished nor sufficiently flat, causing significant beam distortion. Mylar "mirrors" would be better (though still not guaranteed flat), but small, front-surface mirrors (for dental use) are readily available and can be found in the $1 price class so why bother with substitutes. The only downside of using a mirror is the addition of one alignment. However, once that alignment is done, no more are required. ]
The black paper on OTK surfaces is helpful in reducing OTK-internal reflections but, fortunately, its use does not appear to be critical in terms of ensuring all surfaces are black. Most exposed surfaces are covered, but not all, which appears sufficient.
Samples
Samples are easily prepared with 20 drops filling the "viewing window" of the cuvette. This also provides an easy reference for dilution. So, keeping with the OTK Beta testing process, sample references were prepared using 'NDCrude', 'AutoDiesel', '5W-30', '20W-50', '80W-90', 'Water' and 'EVO' (Extra Virgin Olive oil) as zero-fluorescence baseline samples.
[ Note: The cuvettes are inexpensive and appear to function ok but dealing with the various oils is still inherently messy. So, to minimize direct oil exposure to the OTK measurement device and the user, it is recommended that a plastic container, with lid, be included as a storage box and means for organizing the samples being tested. It was also found convenient to dedicate a single eye dropper to each oil and place each dropper inside a labeled zip-lock sandwich bag between uses to avoid cross-contamination of samples. Also, it is possible to write directly on the cuvettes using a Sharpie pen, which works better than using paper labels which easily become contaminated with oil and smear. ]

When diluting an oil, NDCrude for example, I started with 20 drops of EVO (Extra Virgin Olive oil) in a fresh cuvette and then added 1 drop of NDCrude. However, it was clear that the NDCrude would not instantly mix with EVO. This was in part because the of the cuvette's narrow viewing section. However, the solution is simple: placing thumb on the bottom and index finger on the lid, the solution is shaken ("not stirred") vigorously for ~5 sec. Small micro-bubbles sometimes form but do not appear to have a measurable effect on the spectra.
Calibration
Calibration is important so for these experiments, the plots are calibrated for wavelength using a CFL (using 435nm and 546nm peaks) and a Solux 4700K with published spectral data for gain-correction over the 400-650nm band (See: https://publiclab.org/notes/stoft/03-06-2015/plab-3-gain-correction).

This first image simply provides a baseline OTK system reference as it shows 1) a water sample with no fluorescence (thus the system noise floor) and 2) a wavelength and gain corrected CFL spectrum.
[ Note: There is no useful information in the 405nm spike other than to visualize the signal as a confirmation that the UV laser is working. Therefore, these OTK plots have auto-deleted the 405nm spike so that the only comparison is the oil's fluorescence. ]
The big spike at 405nm, which is typically seen the the SWB plots and in PLab notes, is actually a function of diffraction thought the plastic of the cuvette and the inability to accurately align the laser with the cuvette. The better the laser alignment, the lower the 405nm signal and the better the data will be just above 405nm.
Fluorescence
To check the OTK system, with 405nm laser and measurement of fluorescence, we need an initial baseline. Below is a plot of EVO with no attenuation in the optical path.

The 405nm signal is visible but notice the low intensity (relative to many of the OTK plots posted on the PLab site). I believe this is primarily a result of careful alignment of the optics which substantially reduces the diffraction effects of the plastic cuvette (the beam is nearly perpendicular and centered on the cuvette side.).
Yes, there is a visible "glow" when EVO is illuminated by the 405nm laser (which is primarily fluorescence of chlorophyll) so it is worth investigating the EVO spectra closer. Below is a more detailed plot:

The 405nm laser spike is small but clearly visible but there are also two small response peaks at 450nm and 680nm. The one at 450nm has sufficient noise and a lack of correlation between the Red and Blue channels such that the combined RGB spectra is virtually nil. The signal at 680nm is from the "reddish" visible fluorescence response from the chlorophyll. However, for this specific EVO (Costco) at least, that signal is outside the normal sensitivity span of the webcam (400-650nm) so is significantly attenuated. Note that, as a detector, the webcam is not a good choice for observing editable oils. (Below is a plot from Ocean Optics web site of the typical fluorescence spectra of such oils.) As a result, EVO can be used as a base reference oil simply because it's fluorescence does not interfere with the primary fluorescence spectra (visible to the webcam detector) of the oil samples under test.

Verification
It is good to have a check of the RGB channel data (to maximize the signal without clipping) before proceeding and the following plot shows the individual levels for the 80W-90 sample:

Next I compared the non-Gain-Corrected data with the Solux 4700K Gain-Corrected data to ensure the gain correction is not causing some irregular spectral shape distortion. Yes, there is a difference, but, based on prior work (referenced above) the gain-corrected plot is believable. The BLUE plot is the UN-Corrected plot (CFL for wavelength but not for gain) and the RED plot is the Gain-Corrected data. The gain-correction effect is visible but does not significantly change the general "shape" of the fluorescence spectra.

Given the above baseline as proof of system performance, the full set of OTK Beta default samples are shown below:

There are a couple of details to note relative to this plot. 1) The fluorescence light path was attenuated such that the Blue channel was near maximum for the largest signals. [See the section on attenuation below.] 2) For each of the plots, the Y-Pos of the pixel line used to acquire the spectral data was "fine-tuned" for maximum peak signal.
[ Note: In theory, once the OTK system is configured, the exact same Y-Pos should ideally be used for acquiring the spectra. However, in the case of this prototype, there is a possible practical flaw in that theory. It is quite difficult to perform a totally accurate alignment of DVD diffraction grating with the webcam. This resulted in a very slight "slant" to the color band in the camera image which results in a slight non-uniformity from end-to-end within that band. In addition, the small alignment errors of the slit, relative to the DVD and camera form some additional error. The resulting effect can be seen in the plot below where the signals for each sample were not adjusted for optimal Y-Pos. ]

So, which is more accurate in terms of representing the fluorescence spectra? I tend to believe that optimizing each spectral curve (assuming that change is a small variation (which it was with this prototype) will tend to reduce the total errors but I cannot yet prove it does.
Repeatability
This leads to the question of the repeatability of the OTK Proto3 system measurements. If either a single OTK cannot get the same results when measuring the same sample at different times, the results must be suspect. If the results from measuring the same sample using different OTK devices do not give the same results, those results must be suspect.
First, there are two types of cuvettes; 1) the OTK-Beta kit cuvette with smooth "window" and clear square lid, and 2) the same size cuvette with "rippled-surface" window and round blue top. As a test, both were filled with 20 drops of 80W-90 oil. Using the same attenuation, the results are shown below:

The RED curve is from the original "smooth-window, clear-cap" cuvette and the BLUE curve is from the "rippled-window, blue-cap" cuvette presently listed in the PLab on-line store.
The Good: The fluorescence spectra are very similar in shape and close in magnitude. The Bad: The peak magnitudes are not actually the same. Conclusion: When measuring samples, it is best to use the same type of cuvette when comparing relative magnitudes -- otherwise an additional error will be introduced into the measurement.
Next, let's look at measurement-to-measurement error. To test this, the '80W-90' oil, which has a strong signal, was measured five times, with the cuvette being removed and re-installed in the holder and alternating its orientation 180 degrees each time. After an initial tuning of the Y-Pos for best signal, the rest of the system remained unchanged; including the Y-Pos for the pixel-line of data used to acquire the spectrum. In theory, there should be no difference so any variation is a measure of measurement repeatability. The combined plot is shown below:

To extract the implications of these 5 plots, it is necessary to look at the effect of the visible variation in terms of the signal being measured. Remember, where the signal intensity is low, the repeatability error become much more significant.

[ Note that the above plot shows that for relative measurements which asses only intensity, only the 450-550nm region have sufficient measurement repeatability to be considered usable. Visualization of spectral fluorescence "shape" factors or the fluorescence peak spectral response wavelength are different measurements which may be less dependent on signal level repeatability. ]
A closer look at the error over 425-575nm is plotted below:

[ Note that even though the error variation is "well behaved" it still represents a minimum of +/- 5% of value. Since even when adding Solux gain-correction which carries a +/- 10% error, the best performance holds at least +/- 15% error for any given measurement. ]
Dilution of NDCrude
As observed in the plots above, 'NDCrude' is visually quite opaque, raising the question of whether the lack of visible fluorescence was likely due to density alone. The dilution procedure was simply to start with 20 drops of EVO and then add drops of 'NDCrude' and mix by rapid shaking (see procedure notes above). The resulting measured ratios were 1:20, 2:20, 5:20, 10:20 ND:EVO mixtures. The results are plotted below:

Several details should be noted from the plotted data. 1) Clearly, the default ND sample was simply too opaque. 2) A 10:20 dilution is also too opaque. 3) Just a 1:20 dilution provides a significant signal. 4) The "optimal" dilution appears to be in the ratio range of 2:20 to 5:20. 5) There are some detailed variation in the ND fluorescence spectral "signature" as related to the dilution ratio which cannot, as yet, be explained; they may be just noise.
[ Note: One other interesting observation. The "center" wavelength of the NDCrude oil fluorescence "peak" does NOT remain constant as the concentration changes. This undermines the hope that "peak wavelength" might be used as one determinant factor of oil type. ]
Dilution Linearity
Now that there is an example basis for observing the effects of dilution using EVO, it is worth applying the technique to '80W-90', which has one of the more active fluorescence spectra, to observe relationship(s) between dilution ratios and florescence spectra. The following plot shows the spectra for a series of dilution ratios:

From these plots the linearity can be extracted by averaging the 460-470nm band for each spectra:

Unfortunately, the dilution process does not show a simple linear correlation between dilution ratio and relative fluorescence intensity. The relationship appears to be non-linear which suggest the fluorescence mechanisms are not yet well understood.
MIXING OIL TYPES
Another test of interest is to mix multiple oils and search for any visual clues which might lead to their differentiation. Two were selected based on having different OTK test characteristics: 1) 80W-90 was selected because it has a strong fluorescence with just a few drops and 2) NDCrude was selected because, when diluted, it appears to have a broader, smoother spectrum. In short, they held some potential differences.
The mixing protocol was simple: 5 drops of 80W-90 and 2 drops of NDCrude were added to 20 drops of EVO; then shaken. The number of drops of 80W-90 was more than the NDCrude because of the desire to mix fluorescence spectra of similar peak spectral amplitude. The results are plotted below:

The RED and BLUE plots represent previous independent 80W and NDCrude dilution spectra which allow comparison to the ORANGE mixed spectra. Despite having similar spectral intensities, the NDCrude spectra appears to predominate in the mixed case. However, there is not enough data within this one test to draw any conclusions; the effect might just be the degree of oil blending or noise.
Spectral Curve Features
[ NOTE: This section has been moved to a new Research Note: https://publiclab.org/notes/stoft/01-26-2016/otk-proto3-analysis ]
Detection Threshold
[ NOTE: This section has been moved to a new Research Note: https://publiclab.org/notes/stoft/01-26-2016/otk-proto3-analysis ]
Conclusions
Yes, this fluorescence technique can detect some oils but even the above observations remain some distance from real device measurement specifications.
Mechanical rigidity of the optical path is a requirement for obtaining repeatable and comparative measurements; this cannot be stressed enough. Even with good stability, intensity repeatability is likely limited to the 450-550nm band.
The spectrometer module should be light-tight, but when used in subdued ambient light, the OTK Proto3 need not be so protected.
Careful optical path alignment can significantly reduce the 405nm laser signal magnitude which can otherwise distort the near-UV end of a fluorescence spectra.
Attenuation is required for some spectra (like '80W-90') but it is best to attenuate the fluorescence signal rather than optically distort the 405nm source. Attenuation should be removed entirely when searching for low concentrations.
It is possible to visually differentiate between the five (5) test samples provided with the OTK Beta package. However, if just using those as the "reference catalog", none of the above observations suggest it will be possible to identify an unknown nor the concentration of that unknown. This is obviously the next most important challenge.
The above observations suggest a minimum measurement error of at least +/- 15% -- even with full wavelength and gain-correction calibrations.
While the detection threshold for 80W-90 as a contaminant is close to a 1:1000 dilution ratio, this is only under ideal lab conditions and says nothing about detecting 80W-90 (or any other oil) under field conditions or in the presence of other contaminants which also fluoresce. (See the 'Mixing Oil Types' section above as an example.)
Appendix: Signal Attenuation
Given the present OTK 405nm 5mW-rated UV pocket laser, the Blue-channel data from the webcam can, in fact, be easily overloaded despite the fluorescence being visually weak in appearance.
Attenuate the fluorescence light, not the UV laser light! The reason is is that the present thin-film attenuation will also distort the light arriving at the cuvette and therefore 1) make the source level a direct function of the film attenuator position (and so amplify any mechanical instability or vibration in the film) and 2) potentially cause an increase in UV diffraction which would increase the unwanted 405nm signal at the webcam. Moving the attenuation film in front of the spectrometer module simplifies the mounting, makes it easier to include attenuation films and keeps any amplitude variations resulting from the mechanics to a minimum.
[ Note: Some additional attenuation "fine tuning" is possible by sliding the spectrometer module further away from the cuvette. However, it is still necessary to "get close" using a fixed attention film. ]
Appendix: Alignment
The 'horizontal' diffraction pattern, which appears in the webcam image, is not completely uniform relative to the choice of the detection line of pixels. So it is valuable to select the maximum signal which does not clip any of the three RGB channels. This is not new for the OTK. What IS new for the OTK, is the stability requirement of additional components to the system with interchangeable cuvette samples. Notice that this prototype design now has multiple components: laser, mirror, cuvette, attenuator, slit, DVD grating and webcam. Even w/o the mirror, there would still be 7 components in the optical chain which must remain mechanically stable and aligned over the life of multiple measurements. If the measurement mechanics are not stable, the measurement error will quickly multiply and make any reasonable measurement impossible. Even with the additional stability of the OTK Proto3 design, there is still a measurement error band for measurement repeatability.
To achieve the highest SNR (Signal to Noise Ratio) , configure the OTK attenuator using the sample with the most fluorescence signal. This will allow measuring and comparing all other related samples without changing any of the OTK system parameters. These parameters include: the laser, the optical path, the cuvette positioning, the attenuator or its position, the spectrometer module and, most importantly, the select "pixel line" in the webcam image which is used to extract the spectral data (or the 3 lines used to average-out the webcam noise).
Appendix: Safety
[ Disclaimer: I do not work in the Laser industry nor am I professionally qualified to advise on laser safety but I would be remiss to not pass along my observations from what I've read online. The following observations and comments are simply my interpretation of technical references publicly available on the web. There is no wish to cause alarm; just a desire to provide some background information to help the user and experimenter make informed choices. ]
PLab's OTK 5mW UV laser is a potential eye hazard although if fully enclosed in an OTK housing, the user is likely well protected. However, for this OTK Proto3 project, where working with "live" laser alignment via direct, up-close observation of the various internal components was a given, I believe some form of qualified UV laser eye protection was clearly advisable.

So, to be safe, I purchased a pair of laser protection glasses from Laser Safety Industries (Model 100-35-110) which provide OD+6 level protection from 190nm-532nm; completely covering the 400-410nm UV laser wavelengths. No, this is not a promotion for LSI's products and no, they are not cheap, but their performance is designed for UV light and is well specified. The OD+6 (OD = Optical Density) rating means that the given UV range will attenuate light to 1 / 106 = 1 millionth of the source level.
The FDA CFR Title 21 limits for UV laser power for wavelengths <=400nm is 1.5 mW / cm2 for >0.25 Sec exposure which is based on the typical 7mm aperture of the human eye. The time is based on the reaction time of the eye, which is generally not fast enough to avoid the laser's effects. (Yes, 405nm is a longer wavelength that the 400nm category cutoff, but we're talking about damage to the human eyes which calls for a more conservative approach. Yes, the FDA limits have a "built-in" 10X buffer but again, it's not worth the risk of operating next to the limits; right?).
A 7mm pupil diameter is 0.384 sq-cm which means that a 5mW pocket laser could produce 13mW/cm2 in the eye which would easily exceed the declared safety limits. In addition, pocket lasers are notorious for poor production Q/A and some have reportedly appeared on the market at 10x their rated power. For safety, it is best to err on the side of caution which suggests a potential direct exposure of 130mW/cm2 or nearly 100x the FDA limit. This would translate to a required safety glass rating of at least OD+3 to provide some added margin for error. While the OD+6 rating of the LSI 100-35 glasses may be more than what is required, they clearly will provide sufficient protection. For close-up work while building this prototype, I thought the cost was justified.
However, these numbers also suggest that using safety glasses which do not have any rating for either OD or wavelength should not be assumed to provide the user with any confidence whatsoever about their use as UV laser safety protection. Unspecified "safety glasses" that claim to "block UVA", but have no other specification, should also be suspect because the UVA "band" is classified as 315-400nm but optical coatings for this "band" may be "rolling off" their attenuation at or below 400nm and so may have significantly reduced protection at 405nm. It's a matter of estimating the degree of protection relative to the anticipated degree of exposure.
Follow related tags:
spectrometer laser fluorescence oil-testing-kit

Oil Test Kit Round 2
I wanted to run through the Oil Test Kit again and see if i could improve my results. So, I started from scratch built a new cuvette holder (this one included the light-blocking flap, cool!) and a new spectrometer.
In this session, besides the mineral oil, I only scanned two concentrations of diesel, and crude oil, but i scanned each of them 6 times and kept the most similar scans in the sets below:
Mineral Oil:

Diesel:

Crude Oil (3 drops in a cuvette of mineral oil)

Crude Oil (full strength):

Next Thoughts
Again, as I had the first time using the OTK, I deepened the slot in the cuvette holder where the fluorescence shines out to be read by the spectrometer. This slot needs to be open lower to better line up with the spectrometer slit.
Getting good reads of spectra seems to require continuous holding/adjusting/positioning of the cuvette holder in relation to the spectrometer. I'm wondering if other people had this experience.
Follow related tags:
oil-testing-kit

Oil Testing Kit Beta Test
I took these spectra for the Oil Testing Kit Beta Program at the end of last year with Stevie (@stevie) and Scott (@eustatic).
First some notes on the procedure:
For calibration the instructions say to look for the middle peak in the blue range, but since the shortest wavelength peak isn't always visible it can be hard to know you are looking at the right thing. It would be helpful to know what the wavelength for the peak should be.
It seems like this might be a two person activity. When prepping or handling samples it seemed prudent to wear the gloves. Then in order to use the computer it seemed like I shouldn't wear the gloves. I ended up doing a Michael Jackson, one glove maneuver, but a second set of hands to work the computer would have been helpful.
After creating a set, I had some trouble searching it to add more spectra to it. The set didn't seem to exist a lot of the time. Once I ended up creating a duplicate set. Is there a way to delete sets?
I had a lot of trouble with the attenuator I was using. I had trouble getting a spectra with peaks that were a decently large size, but not over exposed.
Notes on the spectra:
For some of the spectra I didn't see the laser peak at all (See two of the three spectra for 80W90).
Is there a way to measure attenuation? It seems like this would be an important thing to measure. The kit I was using didn't have any markings to show which part of the attenuation strip I was using, but Stevie said that newer versions of the kit do have this feature.
I'd really like to be able to zoom in and out of the spectra to inspect peaks.
I used the autosmooth feature, but I couldn't figure out how I could smooth it anymore or less than than the default value.
Mineral Oil

This one looks good. A nice laser peak and no other peaks. The peak at the right end of the spectrum is is an echo of the laser, right?
20W50

All three spectra of this sample look similar. That's encouraging.
Diesel

Again all three look similar, but I think I was having trouble with the attenuation on this one. The spectra is pretty small.
80W90

Two of these spectra don't show the laser peak??????
ND Crude

All the spectra look similar, but the peak is really broad and not very distinct looking. I suspect the attenuation was giving me trouble with this sample as well.
5W30

I took a lot of spectra for this one. All of them have a similar broad peak.
****Unknown plus knowns

The unknown sample is one of the known samples, but Stevie didn't tell me which one she was giving to me this time. I plotted it with all of the known for comparison.
Looking at all the known samples with the unknown sample, none of the spectra look very distinct or unique.
****Unknowns only with centers

These spectra are all of the same unknown sample. The heights have been equalized and the centers marked. The peaks are all really broad and the centers are not consistent.
I was not able to identify the unknown based on my spectra. The spectra I found were not unique enough.
Follow related tags:
oil-testing-kit oil-testing-kit-beta

Testing high-brightness 405nm LEDs in fluorescence spectroscopy of oils
What I want to do
After a great 2015 Barnraising session on the topic, @tonyc and I have been trying out a few different designs for a more compact, generalized cuvette holder for the Desktop Spectrometer that could potentially have a dimmable LED with a brightness dial, for either absorption or fluorescence work.
After some discussion, I'd ordered some very bright 405nm blue/UV light emitting diodes (LEDs) from LED Group Buy ($5 each, although we can probably buy the component LED for cheaper, and/or in quantity) but unfortunately they're ~3-3.5v, which means USB power (or a standard Arduino) will burn them out (which I tested :-P).
I looked at using resistors or something more complex, but Adafruit sells a 3.3v "Trinket" which is a tiny Arduino compatible which runs on a 3 volt circuit. Perfect!

My attempt and results
So to start with, I just set up a test using a left over mineral-oil-diluted oil sample from the Oil Testing Kit. I don't have the original samples anymore, but this was either a motor oil or a diluted crude oil. In any case, it fluoresced quite strongly from a 405nm laser.
To my delight, the 405nm LED was very bright, and not only did it clearly create a lot of fluorescence, it did so even when almost 6 inches away, although my smartphone camera wasn't as good at picking this out as my naked eye:

I then took some spectra, and they worked well; the baseline mineral oil only spectrum wasn't as narrow as a laser peak (recorded from a past test), but it was not bad. It extends about 25nm further to the right, so we'll keep that in mind. Below, red is laser, and black (and dimmer RGB channels) is LED:

The comparison of the unknown oil vs the mineral oil:
Here's the same with equalized height (which you can do yourself in the "tools" menu in the embed above):

Questions and next steps
This was all without any dimming at all, by attenuation with a filter strip or by dimming the light. The point was to see if the light was bright enough to produce as strong fluorescence as the laser. So I think this is a success; the next step will be to attach a dimmer dial so the brightness can be tuned, and perhaps reproduce the Oil Testing Kit Public Beta with a full range of samples.
Doing a more thorough test and comparing to other OTK beta tests will help us decide if the broader bandwidth of the LED is an acceptable loss given all the advantages of this method.
Why I'm interested
The advantages of this are many:
- reproducible dimming with a (numbered) dial
- potentially pairing this with a light sensor to make the brightness of the dial an absolute measure -- given a known input spectrum, this might be able to give us a reasonable intensity calibration. I.e. set the dial with no cuvette, to a known measured brightness, then insert the sample.
- more compact design
- safety: no need to worry about laser eye hits, or as much worry about eye protection
- easier to order/ship without special permission (as we need with the lasers)
- adaptable to visible light absorption work too
I'm going to move ahead (really in my spare time, as I have lots of other higher priority coding work to get done) with building one of @tonyc's stacking cuvette prototypes, based on the sketches we did: https://publiclab.org/notes/tonyc/12-02-2015/proof-of-concept-stacking-cuvette-frame-design
Follow related tags:
spectrometer fluorescence cuvette oil-testing-kit

Final results Oil Testing Kit, Boquerón Puerto Rico. Testing Oil Contaminants in Roads.

Introduction
The goal of my wok was to evaluate if oil spots found in roads or parking lots could be analyzed using simple extractions. This post shows final results of th analysis and provide some comments.
Methods
Using mineral oil (MO) and Q-tips (For more details see https://publiclab.org/n/12334 ). Table 1 ( Samples_analysed.xlsx) shows the samples analyzed dilutions and comments on samples.
Results
After the fist few attempts to conduct measurements it was noticed that alignment of the spectrometer unit and the cell holder needed to be adjusted in order to maximize detection. A piece of cardboard (2mm thick was located under the spectrometer body at about 7-8 cm from the slit window to maximize spectrum detection. This procedure had to be conducted each day. One of the diluted standards (80W90) was used to verify spectral quality. I think that this issue is created by the flexibility of the material used and the coupling of the spectrometer and the cell holder unit.. a more rigid material may be used for the base of the cuvette holder which may be better suited to keep alignment issues to a minimal.
The following are the resulting graphs of each standard, unknown or field sample. Standard samples were mostely diluted 1 drop in 1mL unless indicated otherwise. I would not recommend diluting further.
OTK Unknowns Unk94: https://spectralworkbench.org/sets/3029; Unk115: https://spectralworkbench.org/sets/3028; Unk44: https://spectralworkbench.org/sets/show/2793
OTK standards 80W90: https://spectralworkbench.org/sets/3031; Crude Oil: https://spectralworkbench.org/sets/3030; 5w30 5 drops per mL mineral oil: https://spectralworkbench.org/sets/3027; Diesel: https://spectralworkbench.org/sets/3026; 5W30 1 drop per 1 Ml mineral oil: https://spectralworkbench.org/sets/3025; 20W50: https://spectralworkbench.org/sets/show/3021; Field Samples Boq 1: https://spectralworkbench.org/sets/show/3020; This sample showed Boq 2: https://spectralworkbench.org/sets/3033; Boq 3: https://spectralworkbench.org/sets/show/3032 Boq 4 (road blank): https://spectralworkbench.org/sets/3024; Mineral Oil Blank: https://spectralworkbench.org/spectrums/64118.
Of the field samples Boq 1 was the one with greater response (a 1/3 dilution of the original extract was used for the analysis) in contrast with other samples from oily spots (Boq 2 and Boq 3) which extracts needed to be analyzed without dilution to be able to record a visible spectral structure. Boq 2 produced a slight signal in the green zone of the spectrum. Boq 4, the asphalted road extract without oily spots, could not be distinguished from the Mineral Oil Blank.
Overall, this work confirmed that extraction from pavement is feasible with little or no interference under the conditions studied. The pavement from which oily residues were extracted was either paint covered cement or weathered asphalt. We expected that the sample collected from the painted surface would produce the best spectral structure, however, it was the least detectable (Boq2). The other sites consisted of porous weathered asphalt which may have provided with additional surface for the accumulation of oil contamination.
Future Work
These preliminary results are promising, however, more work should be conducted with extracts of asphalted roads at different weathering stages. In addition, samples from parking lots soon after the onset of rains should be collected to evaluate the possibility of sampling quantifying oil-sheens that are discharged into the storm sewage systems. Furthermore, the detection of other types of other fluorochromes should be evaluated as the kit may be adapted to other techniques in microbiology or water transport studies.
Follow related tags:
laser oil-testing-kit otk puerto-rico