Preface
I received an early Beta OTK to assemble and test but found the mechanics of the device much too unstable to perform any real testing so I needed to prototype something more rigid. I also have been recently unable to use SWB for collecting data (Firefox or Chrome) so I also needed an alternate approach for observing the OTK's measurement capabilities.
I'd previously ( https://publiclab.org/notes/stoft/03-02-2015/plab-3-spectrometer-upgrade-prototype ) constructed a more rigid Version-3 of the PLab spectrometer so decided to continue with that mechanical design for integration into a more stable OTK. To avoid the SWB difficulties and retain more flexibility to experiment with data and plots, I wrote new webcam interface and plotting utilities using matlab.
Abstract
Oils derived by heat (cracking) from hydrocarbon compounds (crude oil) contain significant (yet quite variable) Polycyclic Aromatic Hydrocarbons (PAHs) which fluoresce under UV light (typically 300-400nm wavelengths). Webcam spectrometer based fluorescence measurements using a 405nm UV pocket laser can detect the presence of some oils as contaminants. However, the observations below suggest the detection threshold is in the 'ppt' (parts-per-thouand), not 'ppm' level. Such a high threshold prompts serious doubts about measuring contaminant trace amounts at levels where these chemicals, and their byproducts, become toxic.
Despite this limitation, detecting contaminants by UV fluorescence, at dilution levels below what is visually apparent to the eye, may still be useful. This is why it is important to know the measurement procedures, parameters and limits of this device. I hope the following designs and observations will be helpful.
Construction

To perform any reasonable comparison between fluorescence plots, the mechanics of the OTK must be very stable. This cannot be emphasized enough. As some Beta users have reported, the all-paper design requires very careful hand-holding just to get plots. I'd agree with that assessment as I found it impossible to acquire repeatable measurements using the Beta OTK.
So, I removed my PLab Proto3 spectrometer design from the PLab paper enclosure, added a solid end plate behind the webcam and then recovered with a new single-surface black paper over the light sensitive regions. This also makes the PLabP3 spectrometer a single, independent module; making it easy to separately calibrate for wavelength and gain before inserting into the OTK Proto3.
The OTK system need not be very light-tight (assuming a relatively low-ambient light environment -- i.e. turn off the overhead desk lamp when using the OTK). It is the PLab3 spectrometer module which needs to be very light-tight in order to keep the measurement noise to a minimum (which thus maximizes the measurement's dynamic range).
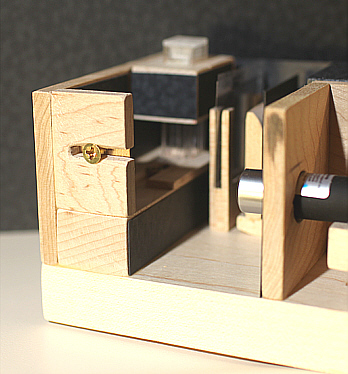
The OTK Proto3 construction material of choice was hard wood (maple) because it cuts cleanly, is mechanically stable, is easy to work with and scrap material was readily available. It is not necessarily the best option for volume production but is quite superior for prototype work where the purpose is to develop design concepts and identify measurement limits.
The addition of a "front-surface" mirror allows for a more compact "folded" mechanical design with the laser mounted in parallel with the spectrometer. Having the front surface of the mirror reflective is important because a "back surface" mirror would allow the mirror glass to interfere with the UV light; causing unwanted refraction and internal reflections as well as attenuating the UV signal

[ Note: As a quick first substitute, an aluminum foil reflector was prepared but even with care, that surface was not sufficiently polished nor sufficiently flat, causing significant beam distortion. Mylar "mirrors" would be better (though still not guaranteed flat), but small, front-surface mirrors (for dental use) are readily available and can be found in the $1 price class so why bother with substitutes. The only downside of using a mirror is the addition of one alignment. However, once that alignment is done, no more are required. ]
The black paper on OTK surfaces is helpful in reducing OTK-internal reflections but, fortunately, its use does not appear to be critical in terms of ensuring all surfaces are black. Most exposed surfaces are covered, but not all, which appears sufficient.
Samples
Samples are easily prepared with 20 drops filling the "viewing window" of the cuvette. This also provides an easy reference for dilution. So, keeping with the OTK Beta testing process, sample references were prepared using 'NDCrude', 'AutoDiesel', '5W-30', '20W-50', '80W-90', 'Water' and 'EVO' (Extra Virgin Olive oil) as zero-fluorescence baseline samples.
[ Note: The cuvettes are inexpensive and appear to function ok but dealing with the various oils is still inherently messy. So, to minimize direct oil exposure to the OTK measurement device and the user, it is recommended that a plastic container, with lid, be included as a storage box and means for organizing the samples being tested. It was also found convenient to dedicate a single eye dropper to each oil and place each dropper inside a labeled zip-lock sandwich bag between uses to avoid cross-contamination of samples. Also, it is possible to write directly on the cuvettes using a Sharpie pen, which works better than using paper labels which easily become contaminated with oil and smear. ]

When diluting an oil, NDCrude for example, I started with 20 drops of EVO (Extra Virgin Olive oil) in a fresh cuvette and then added 1 drop of NDCrude. However, it was clear that the NDCrude would not instantly mix with EVO. This was in part because the of the cuvette's narrow viewing section. However, the solution is simple: placing thumb on the bottom and index finger on the lid, the solution is shaken ("not stirred") vigorously for ~5 sec. Small micro-bubbles sometimes form but do not appear to have a measurable effect on the spectra.
Calibration
Calibration is important so for these experiments, the plots are calibrated for wavelength using a CFL (using 435nm and 546nm peaks) and a Solux 4700K with published spectral data for gain-correction over the 400-650nm band (See: https://publiclab.org/notes/stoft/03-06-2015/plab-3-gain-correction).

This first image simply provides a baseline OTK system reference as it shows 1) a water sample with no fluorescence (thus the system noise floor) and 2) a wavelength and gain corrected CFL spectrum.
[ Note: There is no useful information in the 405nm spike other than to visualize the signal as a confirmation that the UV laser is working. Therefore, these OTK plots have auto-deleted the 405nm spike so that the only comparison is the oil's fluorescence. ]
The big spike at 405nm, which is typically seen the the SWB plots and in PLab notes, is actually a function of diffraction thought the plastic of the cuvette and the inability to accurately align the laser with the cuvette. The better the laser alignment, the lower the 405nm signal and the better the data will be just above 405nm.
Fluorescence
To check the OTK system, with 405nm laser and measurement of fluorescence, we need an initial baseline. Below is a plot of EVO with no attenuation in the optical path.

The 405nm signal is visible but notice the low intensity (relative to many of the OTK plots posted on the PLab site). I believe this is primarily a result of careful alignment of the optics which substantially reduces the diffraction effects of the plastic cuvette (the beam is nearly perpendicular and centered on the cuvette side.).
Yes, there is a visible "glow" when EVO is illuminated by the 405nm laser (which is primarily fluorescence of chlorophyll) so it is worth investigating the EVO spectra closer. Below is a more detailed plot:

The 405nm laser spike is small but clearly visible but there are also two small response peaks at 450nm and 680nm. The one at 450nm has sufficient noise and a lack of correlation between the Red and Blue channels such that the combined RGB spectra is virtually nil. The signal at 680nm is from the "reddish" visible fluorescence response from the chlorophyll. However, for this specific EVO (Costco) at least, that signal is outside the normal sensitivity span of the webcam (400-650nm) so is significantly attenuated. Note that, as a detector, the webcam is not a good choice for observing editable oils. (Below is a plot from Ocean Optics web site of the typical fluorescence spectra of such oils.) As a result, EVO can be used as a base reference oil simply because it's fluorescence does not interfere with the primary fluorescence spectra (visible to the webcam detector) of the oil samples under test.

Verification
It is good to have a check of the RGB channel data (to maximize the signal without clipping) before proceeding and the following plot shows the individual levels for the 80W-90 sample:

Next I compared the non-Gain-Corrected data with the Solux 4700K Gain-Corrected data to ensure the gain correction is not causing some irregular spectral shape distortion. Yes, there is a difference, but, based on prior work (referenced above) the gain-corrected plot is believable. The BLUE plot is the UN-Corrected plot (CFL for wavelength but not for gain) and the RED plot is the Gain-Corrected data. The gain-correction effect is visible but does not significantly change the general "shape" of the fluorescence spectra.

Given the above baseline as proof of system performance, the full set of OTK Beta default samples are shown below:

There are a couple of details to note relative to this plot. 1) The fluorescence light path was attenuated such that the Blue channel was near maximum for the largest signals. [See the section on attenuation below.] 2) For each of the plots, the Y-Pos of the pixel line used to acquire the spectral data was "fine-tuned" for maximum peak signal.
[ Note: In theory, once the OTK system is configured, the exact same Y-Pos should ideally be used for acquiring the spectra. However, in the case of this prototype, there is a possible practical flaw in that theory. It is quite difficult to perform a totally accurate alignment of DVD diffraction grating with the webcam. This resulted in a very slight "slant" to the color band in the camera image which results in a slight non-uniformity from end-to-end within that band. In addition, the small alignment errors of the slit, relative to the DVD and camera form some additional error. The resulting effect can be seen in the plot below where the signals for each sample were not adjusted for optimal Y-Pos. ]

So, which is more accurate in terms of representing the fluorescence spectra? I tend to believe that optimizing each spectral curve (assuming that change is a small variation (which it was with this prototype) will tend to reduce the total errors but I cannot yet prove it does.
Repeatability
This leads to the question of the repeatability of the OTK Proto3 system measurements. If either a single OTK cannot get the same results when measuring the same sample at different times, the results must be suspect. If the results from measuring the same sample using different OTK devices do not give the same results, those results must be suspect.
First, there are two types of cuvettes; 1) the OTK-Beta kit cuvette with smooth "window" and clear square lid, and 2) the same size cuvette with "rippled-surface" window and round blue top. As a test, both were filled with 20 drops of 80W-90 oil. Using the same attenuation, the results are shown below:

The RED curve is from the original "smooth-window, clear-cap" cuvette and the BLUE curve is from the "rippled-window, blue-cap" cuvette presently listed in the PLab on-line store.
The Good: The fluorescence spectra are very similar in shape and close in magnitude. The Bad: The peak magnitudes are not actually the same. Conclusion: When measuring samples, it is best to use the same type of cuvette when comparing relative magnitudes -- otherwise an additional error will be introduced into the measurement.
Next, let's look at measurement-to-measurement error. To test this, the '80W-90' oil, which has a strong signal, was measured five times, with the cuvette being removed and re-installed in the holder and alternating its orientation 180 degrees each time. After an initial tuning of the Y-Pos for best signal, the rest of the system remained unchanged; including the Y-Pos for the pixel-line of data used to acquire the spectrum. In theory, there should be no difference so any variation is a measure of measurement repeatability. The combined plot is shown below:

To extract the implications of these 5 plots, it is necessary to look at the effect of the visible variation in terms of the signal being measured. Remember, where the signal intensity is low, the repeatability error become much more significant.

[ Note that the above plot shows that for relative measurements which asses only intensity, only the 450-550nm region have sufficient measurement repeatability to be considered usable. Visualization of spectral fluorescence "shape" factors or the fluorescence peak spectral response wavelength are different measurements which may be less dependent on signal level repeatability. ]
A closer look at the error over 425-575nm is plotted below:

[ Note that even though the error variation is "well behaved" it still represents a minimum of +/- 5% of value. Since even when adding Solux gain-correction which carries a +/- 10% error, the best performance holds at least +/- 15% error for any given measurement. ]
Dilution of NDCrude
As observed in the plots above, 'NDCrude' is visually quite opaque, raising the question of whether the lack of visible fluorescence was likely due to density alone. The dilution procedure was simply to start with 20 drops of EVO and then add drops of 'NDCrude' and mix by rapid shaking (see procedure notes above). The resulting measured ratios were 1:20, 2:20, 5:20, 10:20 ND:EVO mixtures. The results are plotted below:

Several details should be noted from the plotted data. 1) Clearly, the default ND sample was simply too opaque. 2) A 10:20 dilution is also too opaque. 3) Just a 1:20 dilution provides a significant signal. 4) The "optimal" dilution appears to be in the ratio range of 2:20 to 5:20. 5) There are some detailed variation in the ND fluorescence spectral "signature" as related to the dilution ratio which cannot, as yet, be explained; they may be just noise.
[ Note: One other interesting observation. The "center" wavelength of the NDCrude oil fluorescence "peak" does NOT remain constant as the concentration changes. This undermines the hope that "peak wavelength" might be used as one determinant factor of oil type. ]
Dilution Linearity
Now that there is an example basis for observing the effects of dilution using EVO, it is worth applying the technique to '80W-90', which has one of the more active fluorescence spectra, to observe relationship(s) between dilution ratios and florescence spectra. The following plot shows the spectra for a series of dilution ratios:

From these plots the linearity can be extracted by averaging the 460-470nm band for each spectra:

Unfortunately, the dilution process does not show a simple linear correlation between dilution ratio and relative fluorescence intensity. The relationship appears to be non-linear which suggest the fluorescence mechanisms are not yet well understood.
MIXING OIL TYPES
Another test of interest is to mix multiple oils and search for any visual clues which might lead to their differentiation. Two were selected based on having different OTK test characteristics: 1) 80W-90 was selected because it has a strong fluorescence with just a few drops and 2) NDCrude was selected because, when diluted, it appears to have a broader, smoother spectrum. In short, they held some potential differences.
The mixing protocol was simple: 5 drops of 80W-90 and 2 drops of NDCrude were added to 20 drops of EVO; then shaken. The number of drops of 80W-90 was more than the NDCrude because of the desire to mix fluorescence spectra of similar peak spectral amplitude. The results are plotted below:

The RED and BLUE plots represent previous independent 80W and NDCrude dilution spectra which allow comparison to the ORANGE mixed spectra. Despite having similar spectral intensities, the NDCrude spectra appears to predominate in the mixed case. However, there is not enough data within this one test to draw any conclusions; the effect might just be the degree of oil blending or noise.
Spectral Curve Features
[ NOTE: This section has been moved to a new Research Note: https://publiclab.org/notes/stoft/01-26-2016/otk-proto3-analysis ]
Detection Threshold
[ NOTE: This section has been moved to a new Research Note: https://publiclab.org/notes/stoft/01-26-2016/otk-proto3-analysis ]
Conclusions
Yes, this fluorescence technique can detect some oils but even the above observations remain some distance from real device measurement specifications.
Mechanical rigidity of the optical path is a requirement for obtaining repeatable and comparative measurements; this cannot be stressed enough. Even with good stability, intensity repeatability is likely limited to the 450-550nm band.
The spectrometer module should be light-tight, but when used in subdued ambient light, the OTK Proto3 need not be so protected.
Careful optical path alignment can significantly reduce the 405nm laser signal magnitude which can otherwise distort the near-UV end of a fluorescence spectra.
Attenuation is required for some spectra (like '80W-90') but it is best to attenuate the fluorescence signal rather than optically distort the 405nm source. Attenuation should be removed entirely when searching for low concentrations.
It is possible to visually differentiate between the five (5) test samples provided with the OTK Beta package. However, if just using those as the "reference catalog", none of the above observations suggest it will be possible to identify an unknown nor the concentration of that unknown. This is obviously the next most important challenge.
The above observations suggest a minimum measurement error of at least +/- 15% -- even with full wavelength and gain-correction calibrations.
While the detection threshold for 80W-90 as a contaminant is close to a 1:1000 dilution ratio, this is only under ideal lab conditions and says nothing about detecting 80W-90 (or any other oil) under field conditions or in the presence of other contaminants which also fluoresce. (See the 'Mixing Oil Types' section above as an example.)
Appendix: Signal Attenuation
Given the present OTK 405nm 5mW-rated UV pocket laser, the Blue-channel data from the webcam can, in fact, be easily overloaded despite the fluorescence being visually weak in appearance.
Attenuate the fluorescence light, not the UV laser light! The reason is is that the present thin-film attenuation will also distort the light arriving at the cuvette and therefore 1) make the source level a direct function of the film attenuator position (and so amplify any mechanical instability or vibration in the film) and 2) potentially cause an increase in UV diffraction which would increase the unwanted 405nm signal at the webcam. Moving the attenuation film in front of the spectrometer module simplifies the mounting, makes it easier to include attenuation films and keeps any amplitude variations resulting from the mechanics to a minimum.
[ Note: Some additional attenuation "fine tuning" is possible by sliding the spectrometer module further away from the cuvette. However, it is still necessary to "get close" using a fixed attention film. ]
Appendix: Alignment
The 'horizontal' diffraction pattern, which appears in the webcam image, is not completely uniform relative to the choice of the detection line of pixels. So it is valuable to select the maximum signal which does not clip any of the three RGB channels. This is not new for the OTK. What IS new for the OTK, is the stability requirement of additional components to the system with interchangeable cuvette samples. Notice that this prototype design now has multiple components: laser, mirror, cuvette, attenuator, slit, DVD grating and webcam. Even w/o the mirror, there would still be 7 components in the optical chain which must remain mechanically stable and aligned over the life of multiple measurements. If the measurement mechanics are not stable, the measurement error will quickly multiply and make any reasonable measurement impossible. Even with the additional stability of the OTK Proto3 design, there is still a measurement error band for measurement repeatability.
To achieve the highest SNR (Signal to Noise Ratio) , configure the OTK attenuator using the sample with the most fluorescence signal. This will allow measuring and comparing all other related samples without changing any of the OTK system parameters. These parameters include: the laser, the optical path, the cuvette positioning, the attenuator or its position, the spectrometer module and, most importantly, the select "pixel line" in the webcam image which is used to extract the spectral data (or the 3 lines used to average-out the webcam noise).
Appendix: Safety
[ Disclaimer: I do not work in the Laser industry nor am I professionally qualified to advise on laser safety but I would be remiss to not pass along my observations from what I've read online. The following observations and comments are simply my interpretation of technical references publicly available on the web. There is no wish to cause alarm; just a desire to provide some background information to help the user and experimenter make informed choices. ]
PLab's OTK 5mW UV laser is a potential eye hazard although if fully enclosed in an OTK housing, the user is likely well protected. However, for this OTK Proto3 project, where working with "live" laser alignment via direct, up-close observation of the various internal components was a given, I believe some form of qualified UV laser eye protection was clearly advisable.

So, to be safe, I purchased a pair of laser protection glasses from Laser Safety Industries (Model 100-35-110) which provide OD+6 level protection from 190nm-532nm; completely covering the 400-410nm UV laser wavelengths. No, this is not a promotion for LSI's products and no, they are not cheap, but their performance is designed for UV light and is well specified. The OD+6 (OD = Optical Density) rating means that the given UV range will attenuate light to 1 / 106 = 1 millionth of the source level.
The FDA CFR Title 21 limits for UV laser power for wavelengths <=400nm is 1.5 mW / cm2 for >0.25 Sec exposure which is based on the typical 7mm aperture of the human eye. The time is based on the reaction time of the eye, which is generally not fast enough to avoid the laser's effects. (Yes, 405nm is a longer wavelength that the 400nm category cutoff, but we're talking about damage to the human eyes which calls for a more conservative approach. Yes, the FDA limits have a "built-in" 10X buffer but again, it's not worth the risk of operating next to the limits; right?).
A 7mm pupil diameter is 0.384 sq-cm which means that a 5mW pocket laser could produce 13mW/cm2 in the eye which would easily exceed the declared safety limits. In addition, pocket lasers are notorious for poor production Q/A and some have reportedly appeared on the market at 10x their rated power. For safety, it is best to err on the side of caution which suggests a potential direct exposure of 130mW/cm2 or nearly 100x the FDA limit. This would translate to a required safety glass rating of at least OD+3 to provide some added margin for error. While the OD+6 rating of the LSI 100-35 glasses may be more than what is required, they clearly will provide sufficient protection. For close-up work while building this prototype, I thought the cost was justified.
However, these numbers also suggest that using safety glasses which do not have any rating for either OD or wavelength should not be assumed to provide the user with any confidence whatsoever about their use as UV laser safety protection. Unspecified "safety glasses" that claim to "block UVA", but have no other specification, should also be suspect because the UVA "band" is classified as 315-400nm but optical coatings for this "band" may be "rolling off" their attenuation at or below 400nm and so may have significantly reduced protection at 405nm. It's a matter of estimating the degree of protection relative to the anticipated degree of exposure.
6 Comments
This is super, and very impressive, Dave. I have a number of comments/questions, but I'll start with just a few:
I'm very surprised to hear that EVO did not fluoresce for you, and that you're using it as a baseline/solvent -- it had very clear pinkish fluorescence when I tested it on multiple occasions.
The effects of diluting crude oil may have multiple sources, but one is called "quenching" in the published literature, and is when the color of the liquid itself (as you describe) filters some wavelengths out. This can clearly affect the peak height wavelength position.
@ethanbass had suggested at the Barnraising that we could standardize the opacity of solutions, rather than their concentration, by using absorption spectroscopy, or even an opacity reference card. Thoughts?
I especially appreciated your graph of "repeatability error" and wonder if you'd considered using averaged data in your later analyses, using repeated scans to improve signal to noise. Maybe you did and I missed this.
More thoughts soon! There's a lot in here. Thanks as always, and I must also note that you're an impressive woodworker!
Is this a question? Click here to post it to the Questions page.
Reply to this comment...
Log in to comment
"visually differentiate between the five (5) test samples" - here, you mean based on qualitative visual inspection of the graphs, right? Do you believe the gain correction is absolutely needed for this? Just curious.
We've discussed (@gretchen, can you help me with a link?) using an area-based measure for curve centering, for comparisons. Do you think this'd be equally, more, or less affected by some of the peak shifting effects you describe? Are there other measures of center position that might perform better?
Laser eye safety is of course a high concern for us, and is part of what's motivated some of @tonyc and my explorations into LED-based fluorescence, along with very tight control of the input light source brightness (with a dial!). Any thoughts on the viability of this method, esp. as it also reduces the # of parts which must be aligned, and increases rigidity enormously (and removes the need to align a beam path, for the most part)? https://publiclab.org/notes/warren/01-05-2016/testing-high-brightness-405nm-leds-in-fluorescence-spectroscopy-of-oils
Is this a question? Click here to post it to the Questions page.
Reply to this comment...
Log in to comment
Jeff, thanks.
1 - Yes, you are right, there is a "glow" from EVO. However, that peak is small and out at 650nm past where it has little effect. I added another plot to show this affect up above in the 'Fluorescence' subsection.
2,3 - Sounds plausible. However, I don't see the value in dilution for opacity uniformity.
4 - Yes, averaging multiple plots of the same sample would likely reduce the noise. However, measurement uncertainty would remain as all data samples might be, by chance, not an even distribution -- but yes, averaging is generally helpful.
A - Yes, subjective visual analysis. Gain-correction: It depends on what is being measured. If you want only to look for a 20% level change at 550nm, then maybe it doesn't matter. However, when attempting to build a measurement device like this, and have the measurements mean something, it is necessary to identify what the measurements mean -- i.e. you need to develop Specifications. It is the only way to, ultimately, compare measurements made using separate instruments.
B - Yes, I'm thinking about ways to get quantitative results from qualitative factors so "area-based" or other such measures would be interesting to test. I figure I have enough stable data to try a few. What is not clear, even as a guess, is if there will be any correlation at all.
C - I believe LEDs generally have a much much wider spectral bandwidth (than lasers) -- which I think was also evident in your plots in the RN you linked. This is a major problem as 1) it could significantly affect the fluorescence spectra, complicating that spectra by mixing multiple fluorescence signatures instead of having just one, and 2) the beam angle of LED is very broad (compared to a laser) so there would be significant diffraction products which would intensify the ~400nm signal and obscure the fluorescence signature and the beam spread is effectively much lower power density within the sample thus significantly decreasing the fluoresce-signal:source-signal ratio. If a compromise could be found (integral lens, etc) the LED would need to be driven from a well regulated source with low noise.
Reply to this comment...
Log in to comment
I just ran some new calculations looking at the curves from my existing data and found a possible correlation between oil density and the centroid of the fluorescence curve. I posed the results and plot in a new subsection above: "Spectral Curve Features". It may not be a linear relationship and there's questions from the dilution data but the results appear to be more than just chance.
Re: UV LEDs. I just did a quick DigiKey search for UV laser diodes. As one reference point, $15 will get you a 365nm, 1.5mW CW, 10% optical beam-width with a -6dB wavelength bandwidth of about 100nm. So, that 3X lower power than the pocket laser, a wide dispersion and wide bandwidth. LEDs do not present a simple solution.
Reply to this comment...
Log in to comment
This is a really great post, Dave!
As for the concentration effects, in addition to quenching, there is also shielding, and there can be another phenomenon (whose name I am forgetting), where relaxing fluorophores can actually excite others if the HOMO and LUMO are close enough. If this sort of chain-reaction fluorescence were occurring, I would expect a broader, or skewed peak with a red tail in the more concentrated samples, but in the 80W90 solutions you have shown, it looks like the less concentrated samples actually have broader peaks and are similarly skewed as the more concentrated samples.
For sample comparison, we used to use the wavelength at maximum intensity as the primary distinguishing feature. We would normalize the area under the curve and then compare lambda-max, though normalizing the area under the curve did not actually affect the position of lamba-max. Based on conversations that Jeff and I have had about the differences in web cam sensitivities throughout the visible spectrum and especially at band-boundaries, it makes sense that comparing lambda-max wouldn't be appropriate here. However, given your Solux gain-correction (which is fabulous!), that should make lambda-max comparisons relevant.
Reply to this comment...
Log in to comment
Gretchen, thanks for the insight.
I'd read that the generally broad fluorescence spectrum is, as would be expected, a combination of many spectral responses (oils contain so many separate molecules) so what you suggest make sense. Unfortunately, also as you suggest, this makes finding identifying features (which might correlate oil type with spectral "shape") much more difficult because finding independent factors to extract are so buried in the larger spectra and spectral noise. From other plots I've seen on the web (which cover a much more broad spectrum than the webcam can see) the 400-650nm span only contains very broad features so we're looking for very low SNR indicators. I think the primary benefit of the Solux correction is in lowering spectral errors when analyzing "curve shapes".
I've also read evidence that, even with a single oil type, the shift in peak center nm does vary with concentration (probably due to the factors you referenced); which also supports my observations. I believe this is primarily why equalizing areas before comparison, doesn't help. So, I'm waiting on more cuvettes from PLab to perform some comparisons between oil types where the dilution has been adjusted to make the fluorescence peak values equal as means of chemical normalizing out some of these variables. It looks like any type-related signal within these spectra is relatively weak -- thus some form of isolation technique, that does not add to the noise, is required. What I don't know yet is if just having different concentrations, even if the fluorescence "intensity" is the same, will still retain to large an error term.
Reply to this comment...
Log in to comment
Login to comment.