Oil testing kit Blog

Oil Test Kit Beta Program - Data Analysis
This is an article by Yagiz Sutcu for Community Science Forum Issue #1 on DYI Oil Testing. Buy a copy in the Public Lab Store.
The Oil Testing Kit Beta Program was designed to provide proof of concept that the kit did in fact allow users to distinguish oil and identify potential use cases for the kit. While 9 of the 20 beta participants posted research notes, as of January 2016, only 4 of the original beta participants completed the entire beta program. So far 8 user have uploaded 3 spectra from 5 different samples (3 different engine oils, diesel and crude) and statistical analysis was performed based on this data.
To create comparisons, the traditional methods for reference-library searching are typically based on the assessment of similarity metrics calculated via peak table comparisons, or more commonly, from those generated by full spectrum comparisons. Full spectrum approaches typically generate a “hit quality index” (HQI) between the unknown spectrum and each library spectrum. One way of calculating the HQI is based on Euclidean distance. In this study, we considered Euclidian distance-based similarity metric for spectral data comparisons.
There are two commonly used methods to normalize spectral data: (1) Dot product normalization – which essentially normalizes the spectrum based on the total area under the curve; (2) Scaling normalization - which normalizes the spectrum based on the height of a peak of interest. In this study, AUC equalization-based normalization for wavelength range [420-710 nm] is selected. For the Preliminary Results, we compared intra-user and inter-user spectral data of same and different kind of samples in order to determine the identification performance of 5 different types of pollutants. Preliminary results of this study showed that the identification of these 5 different types of pollutants by comparing different users’ samples is not possible. Some of the reasons for performance are: calibration errors between users; hardware/design differences; instability of spectrometer. Regarding the OTK attachment, same user/device-based identification performance is significantly better than inter-user identification. However, it cannot be considered as acceptable with current performance.
For future work on the OTK, hardware design improvements (better stability, solid connection between OTK and spectrometer) along with better calibration algorithms (wavelength and amplitude) will probably improve the identification performance. Furthermore, some advanced signal processing techniques combined with template/cluster generation for data classes might be a good idea for achieving better identification.
Read the full analysis here: https://groups.google.com/forum/#!topic/plots-spectrometry/S5Zs4r1xXyI
Follow related tags:
spectrometer oil-testing-kit with:ygzstc

DIY Oil Testing Narratives
This is an article by Ann Chen for Community Science Forum Issue #1 on DYI Oil Testing. Buy a copy in the Public Lab Store.
Through a Homebrew Sprint Fellowship, I have spent the last few months working with Gretchen Gerke, Public Lab’s Data & Advocacy Steward on gathering stories from within the Public Lab community and beyond to develop use case examples for when the Oil Testing Kit could be useful. Many of these stories came from the Gulf Coast region and center around oil contamination of land and water. Landfill runoff, oil spills from transport and extraction, or leaks from machinery and equipment are just a few of the examples given by the people I interviewed.
Scott Eustis, from the Gulf Restoration Network (Louisiana) and also a longtime Public Lab member and organizer identified three specific sites of potential oil contamination that come from very different sources. With some help from Stevie Lewis, I connected with Margie Vicknair, an environmental activist and long-time Gulf Coast resident about the history of the oil and gas industry in Louisiana. It was shocking to learn from her how many pipelines crisscross the state and how some of the older pipelines, built by companies that no longer exist, probably aren’t even correctly mapped.
What was most striking for me was how similar her stories were to the ones related to me by many of the people I spoke with in northwestern Canada where I’ve been researching the impacts of oil and gas industry projects on local communities. Margie’s story about her older brother returning from a hunting trip with stories of animal skeletal remains around an abandoned pit reminded me of the many stories I heard from First Nations people of returning from hunting trips with poisoned fish or moose. Margie’s stories carried a similar urgency as those I heard from northern communities in Alberta and British Columbia. Her plea was for greater accountability. Margie hopes companies will create responsibility reports on oil spills.
Donovan Cameron, a GIS Advisor for Saulteau First Nations in northeastern British Columbia, who oversees environmental and cultural monitoring programs of his traditional territory spoke of the challenges his environmental monitors face when collecting physical data of oil leaks from surveying equipment used by oil and gas companies on their land. An Oil Testing Kit would be a helpful addition to the photographic imagery they are collecting. The purpose for gathering these stories is to provide real-world examples for people interested in using the oil testing kit in the wild. In the last few weeks left of my fellowship, I will use this time to think about the shared stories that exist across regionally different communities, tied together by similar environmental consequences of oil and gas development.
Follow related tags:
louisiana blog oil-testing oil-testing-kit
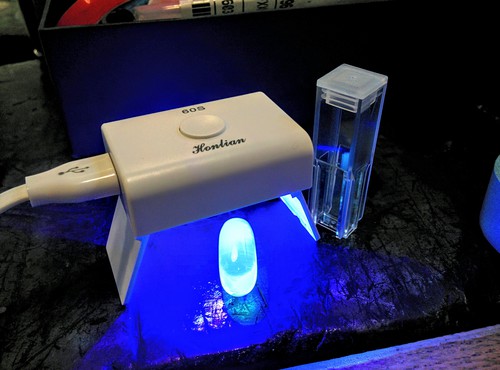
Honlian 60s LED nail polish hardener, various LED fluorescence updates
A nail polish hardening, USB-powered UV lamp at 398nm, for under $4. Read on!
What I want to do
I've been continuing to test cheap LED electronics for use in the Oil Testing Kit, even as we discuss the pros and cons of ultraviolet LED lighting in this great thread in a post by @stoft. One of the takeaways so far is that some published research shows that lower wavelength input (excitation) light can yield more distinctive data when comparing crude oil fluorescence spectra. That is, a 350nm light source causes more clear differences between different oils than a 400 or 450nm light source.
After @dhaffnersr posted a great comparison of LED vs. laser pointers, I ordered a 385nm and a 365nm high-brightness LED, and send one of each to @ethanbass in the hopes that he'll be able to test and compare them. I'm happy to order more, but you can get them here at about $8 each:
- http://www.mouser.com/Search/ProductDetail.aspx?R=LTPL-C034UVH365virtualkey57820000virtualkey859-LTPL-C034UVH365
- http://www.mouser.com/Search/ProductDetail.aspx?R=VLMU3500-385-060virtualkey61370000virtualkey78-VLMU3500-385-060
We're hoping lower wavelengths will also overlap less with the region we're trying to measure fluorescence in (also discussed in @stoft's post's comments, above).
Redesign of cuvette stack
Anyhow, on the construction side, I had been trying to build an enclosure for an Adafruit Trinket, an Arduino compatible tiny 3.3v microcontroller, which I was using to power a 405nm LED i'd bought. The stack (which would go inside the cuvette frame exterior I documented here](/notes/warren/01-25-2016/ongoing-design-of-compact-cuvette-frame)) looks like this, and might still be useful if we go with a smaller component (I did find some, which I'll talk about in a bit):


Cheaper, off-the shelf parts
But in the same comment thread above from @dhaffnersr's post, I'd found a few products which cost around $4, were USB powered, and had an on-off switch, which are designed to cure nail polish with UV light. These are great, and I ordered some to see what wavelength they are, and if they were bright enough. The answer: the white one pictured in the lead image is definitely bright enough, and is ~398nm. You can get that one for $3.84 here: http://www.ebay.com/itm/201481504603
I also found one that is just a tiny USB stick with 2 LEDs on it, which was at about 403nm, but much dimmer. But a promising form-factor for very small work:

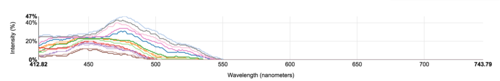
The data is here, showing the bigger white one at 398nm with and without a vial of fish oil (just to proof of concept the fluorescence) and the 403nm tiny board (called Perfect Prime):
Data here: https://spectralworkbench.org/sets/3193
Anyhow, I then tried shoehorning the white LED device into the cuvette frame, such that it's bright enough, the button is accessible, and the cord fits. It worked all right, actually, and is MUCH less complex than the build above (note, there's a cuvette in there, with fish oil in it):

Also, kudos to Brian Degger (@briandegger) and Jeff Hecht (@jeffh) for suggesting the nail polish curing LEDs back in December: https://groups.google.com/d/msg/plots-spectrometry/VNragturGYg/kXjwJYWsBAAJ
Why I'm interested
Ideally the lower wavelength 365nm LEDs will work. But this one is already edging out of the important range (published research such as the Downare and Mullins 1995 piece discards data within 30nm of the excitation wavelength, so that'd get us 430nm+, whereas 365nm would get us 395nm+ -- although we don't know how narrow bandwidth their source light was). And this is a very very easy thing to use -- no soldering or electronics necessary, and it even has an auto-off after 30 seconds or so. So I just want to know, and who knows, maybe we could swap out the LED or something.
Questions and next steps
Can we reproduce oil grading using either one of these off-the-shelf LED setups, or with a lower wavelength LED? Can we make a very easy-to-construct, reliable and bright cuvette frame for fluorescence work?
We need to test out these various LEDs, and @dhaffnersr's recent post on the consistency of LED wavelengths also means we can't take the exact wavelength for granted between LEDs, even from a single manufacturer -- at least more than to within about 8nm. It remains to be seen what effect this has on fluorescence values.
Follow related tags:
spectrometer oil ultraviolet fluorescence

405nm LED vs Laser
Abstract
405nm Lasers provide a powerful, narrow-band, pin-point source of monochromatic UV light to cause fluorescence in oils. The resulting spectra continues to be investigated as a means of contaminant detection using the PLab spectrometers. However, with hopes for a more compact design, new high-power UV LEDs have been proposed as an alternative to the pocket laser. Unfortunately, LEDs are relatively unfocused, have a very wide spectral bandwidth, require significant power supply current and, with the specific device tested for this note, still appear unsuitable for the task.
405nm UV LED
@Jeff recently found an inexpensive, high-power 405nm UV LED ( https://publiclab.org/notes/warren/01-05-2016/testing-high-brightness-405nm-leds-in-fluorescence-spectroscopy-of-oils ) which provided an easy means for performing some comparative tests using my OTK-V3 Proto hardware ( https://publiclab.org/notes/stoft/01-19-2016/otk-proto3 ).
As an easy initial test, the LED was mounted about 1 inch from the cuvette but it became clear that the unfocused light intensity would be insufficient. So the LED was re-mounted within about 2mm of the cuvette and the spectrometer configured with zero attenuation. This resulted in better UV levels as shown below:

While not linear with applied current, the intensity can easily be controlled. However, the wide bandwidth of the LED, as opposed to the laser, is clearly a disadvantage as the 400-450nm data will be potentially corrupted by this wide signal. Also note, that this plot suggests that significant current will be required which is beyond the capability of most USB ports.
Fluorescence
The next plot (below) shows a comparison of the fluorescence spectra of several OTK test chemicals. The negative influence of the LED's broad bandwidth signal is clear. What is also interesting is that the LED's spectral intensity within the fluorescence spectra, seems variable with the type of chemical. My guess is that scattering is the most likely cause since the LED source has a high dispersion (120-deg viewing angle); unlike the laser.

LED vs Laser
The last comparison was of an ND-Crude sample, exposed by the LED and then by the laser. Admittedly, there is some difference in UV exposure intensities, but looking beyond that difference, the impact of the LED on the fluorescence spectra seems obvious. The fluorescence spectra are simply different; which might be related to the oil molecules being excited in different modes than those from the monochromatic laser.

UV Power
The device is described as a 3W "Hyper-Violet" LED "grow light" with 640-680mW of output power. The 405nm UV pocket laser is rated at 5mW but my observations during testing show that comparing single-value power ratings is not sufficient. Clearly, the LED's ability to stimulate fluorescence was not 100x that of the laser.
However, the LED's rated output power is distributed over at least 25nm of bandwidth and it is presently not possible to identify the relationship between the fluorescence stimulation efficiency of a monochromatic source vs a broad-band LED source. However, my observations suggest that the broad-band LED source is much less efficient at producing fluorescence. This is likely a product of energy distributed over a wide bandwidth and inherent dispersion and scattering.
Observations
UV LEDs are becoming more available and at lower costs but there are significant performance tradeoffs vs lasers
Because of they are unfocused, LEDs appear to cause significantly more scattering within test samples which degrades performance
This testing suggests that relative to output power level, LEDs appear to be much less efficient at stimulating fluorescence in the cuvettes than a UV pocket laser. This is likely a product of energy distributed over a wide bandwidth and inherent dispersion and scattering.
Fluorescence spectra performance is degraded by the wide bandwidth of LEDs
There is some evidence that the generated fluorescence spectra are only similar between the LED (broad spectrum) and Laser (monochromatic) stimulation. I believe that most commercial devices use one or more monochromatic sources.
Significant, controlled current would be required which is generally beyond the capability of most USB ports.
The 405nm UV pocket laser still appears as the better solution
Appendix
LED Power
LEDs are doide semiconductors with a higher, and more variable, voltage drop when voltage is applied. Therefore, what is of interest is controlling the current by providing a variable power supply with a series resistor. Without the resistor, the supply voltage would be very difficult to control, especially above 50mA, and so damage to the LED is easy. This specific diode has a max current limit of 750mA -- though my bench supply was limited to about 550mA for testing. The current limiting series resistor was 3 ea 10 ohm, 1watt resistors in parallel for about 3.5 ohms which was reasonable for my 20V adjustable supply.
Be aware that the heat sink the LED is mounted on warms to about 90-deg F with 500mA of current. This is not too high for the device, but in close proximity to the sample, the cuvettes get warm very quickly.
Follow related tags:
spectrometer laser led oil-testing-kit

Baseline comparisons using .09mm slit UV flashlight and UV laser pointer
Here is a comparison of baselines thru a .09mm slit using a UV flashlight@395nm and a UV laser pointer@405nm.
Baseline samples are:
1) Distilled water 2) Isopropyl alcohol 3) Ethanol
Glass test tube - cell length is 2cm


Follow related tags:
fluorescence led oil-testing-kit barnstar:basic
The effect of dilution on the emission spectrum of diesel fuel
What I want to do
I wanted to investigate how the spectral profile an oil sample is affected by the dilution of the sample in mineral oil.
Why I'm interested
If we want to use the oil testing kit to analyze samples collected from the environment, we will need to know how emission spectra are affected by dilution. It may be difficult to measure the concentration of oil in environmental samples with any degree of accuracy. The question arises: how carefully must be control for dilution when we prepare our samples?
Procedure:
I made a series of dilutions of diesel fuel in mineral oil to see how the spectral distribution would be affected. I first loaded approximately 1 ml of pure mineral oil into a cuvette and double checked that it did not exhibit any detectable fluorescence. I then began adding diesel fuel into the cuvette, five drops at a time. I mixed the diesel fuel into the diluent by inverting the cuvette several times before taking measurements of the spectral distribution.
Results:
My data set can be viewed here. I found that the neat diesel fuel had a red shifted and spectrally broadened emission spectrum in comparison with the most dilute sample tested (containing 5 drops of diesel in ~ 1 ml of mineral oil or ~1:5). With the exception of a single outlier, the spectra shift monotonically to the right with each increase in diesel concentration across the whole set (after equalizing either by area or by height).
This general trend is in good agreement with the published literature. The figure below, reproduced in Analysis of Crude Petroleum Oils Using Fluorescence Spectroscopy (Reviews in Fluorescence 2005) shows the spectral shifting that occurs in a lighter and a heavier grade of crude oil at various dilution factors.

This shifting of the emission profile is generally attributed to “collisional energy transfer” — the process whereby an excited molecule transfers energy to a larger molecule by colliding with it, which then causes it to fluorescence Visible and Near-Infrared Fluorescence of Crude Oils.
Questions and next steps
I intend to expand upon this area of study by further investigating the effects of dilution on different types of oils included with the OTK. I would also like to see this result replicated by other experimenters in the Public Lab community. If these findings are accurate, they could have important consequences for how we think about the preparation of samples from the environment.
The identification of environmental samples may require the development of methods to control for the dilution of the analyte within a sample. Absorption spectroscopy may prove useful as a tool to help quantify the concentration of oil in environmental samples, so that we can compare them to known standards.
Follow related tags:
spectrometer oil oil-testing-kit barnstar:basic