This is an article by Yagiz Sutcu for Community Science Forum Issue #1 on DYI Oil Testing. Buy a copy in the Public Lab Store.
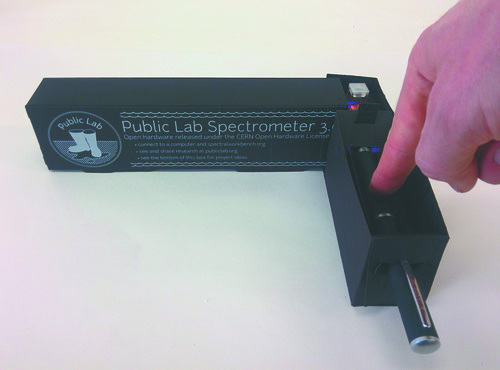
The Oil Testing Kit Beta Program was designed to provide proof of concept that the kit did in fact allow users to distinguish oil and identify potential use cases for the kit. While 9 of the 20 beta participants posted research notes, as of January 2016, only 4 of the original beta participants completed the entire beta program. So far 8 user have uploaded 3 spectra from 5 different samples (3 different engine oils, diesel and crude) and statistical analysis was performed based on this data.
To create comparisons, the traditional methods for reference-library searching are typically based on the assessment of similarity metrics calculated via peak table comparisons, or more commonly, from those generated by full spectrum comparisons. Full spectrum approaches typically generate a “hit quality index” (HQI) between the unknown spectrum and each library spectrum. One way of calculating the HQI is based on Euclidean distance. In this study, we considered Euclidian distance-based similarity metric for spectral data comparisons.
There are two commonly used methods to normalize spectral data: (1) Dot product normalization – which essentially normalizes the spectrum based on the total area under the curve; (2) Scaling normalization - which normalizes the spectrum based on the height of a peak of interest. In this study, AUC equalization-based normalization for wavelength range [420-710 nm] is selected. For the Preliminary Results, we compared intra-user and inter-user spectral data of same and different kind of samples in order to determine the identification performance of 5 different types of pollutants. Preliminary results of this study showed that the identification of these 5 different types of pollutants by comparing different users’ samples is not possible. Some of the reasons for performance are: calibration errors between users; hardware/design differences; instability of spectrometer. Regarding the OTK attachment, same user/device-based identification performance is significantly better than inter-user identification. However, it cannot be considered as acceptable with current performance.
For future work on the OTK, hardware design improvements (better stability, solid connection between OTK and spectrometer) along with better calibration algorithms (wavelength and amplitude) will probably improve the identification performance. Furthermore, some advanced signal processing techniques combined with template/cluster generation for data classes might be a good idea for achieving better identification.
Read the full analysis here: https://groups.google.com/forum/#!topic/plots-spectrometry/S5Zs4r1xXyI
2 Comments
Excellent project. Excellent data analysis. Sorry the project didn't work out the way you wanted.
Reply to this comment...
Log in to comment
Candidates who are done with gseb results 2018 , HSE exams might be eagerly waiting for the declaration of HSE 2018 results www.gseb.org
Reply to this comment...
Log in to comment
Login to comment.