colormap
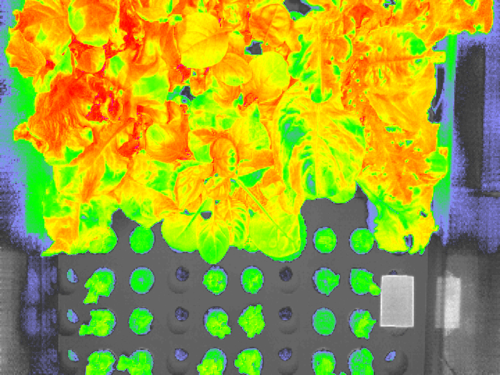
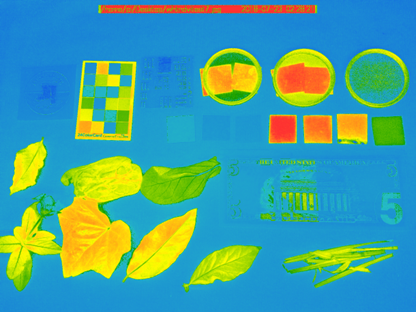
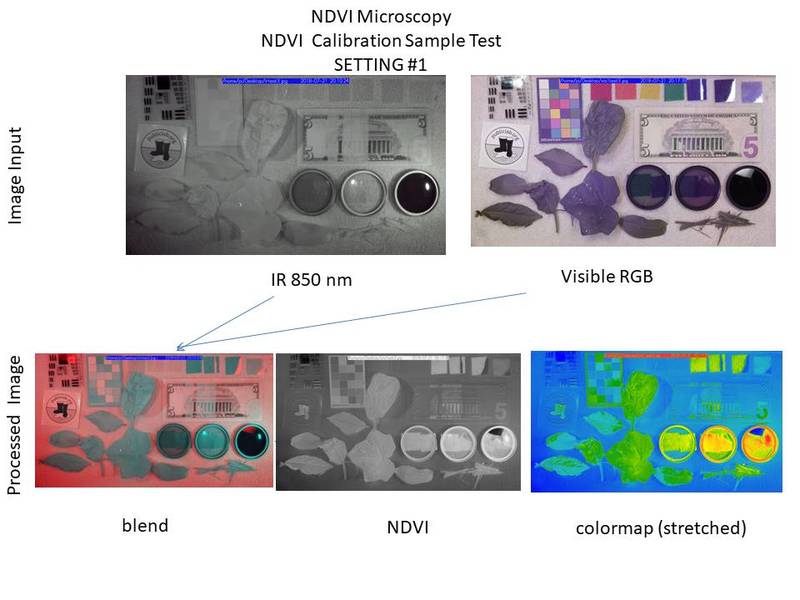
Colormaps are used to show details in monochrome (greyscale) images, by showing pixel intensity values using a wide range of colors instead of just from black => white. This makes finer details easier to see, although it may make it harder for colorblind viewers to read depending on the colors chosen. See https://publiclab.org/ndvi-gradients for a collection of common and useful colormaps by @cfastie. Some colormaps are not linear, meaning they use a set of color changes in one region of the scale to emphasize features with approximately that brightness.
Colormaps are also known as "lookup tables" or LUTs, and the process overall is sometimes known as "false color" (alongside other color compositing techniques).
Learn more in these posts:
Processing a picture from Rasperry Pi NoIR camera with blue filter and getting NDVI values.
Post by @Aezys 1 | 6 years ago
What is the algorithm used in generating the fastie colormap from NDVI in Infragram?
Post by @Jtaw 6 | over 7 years ago
The myterious case of the British Daisy - Fastie colormap in Infragram.org
Post by @cindy_excites 4 | over 9 years ago


