Background
I am working to add rich annotation functionality to MapKnitter as part of Google Summer of Code (read about my project here: http://publiclab.org/notes/justinmanley/03-18-2014/mapknitter-annotations-using-fabric-js-gsoc-2014-proposal). I'm about to start coding next week. The purpose of this research note is to:
- Enumerate precisely the annotation features that are desirable (in greater detail than in my proposal)
- Discuss strategies for implementing these features
- Determine whether raster or vector formats would be more suited to the type of annotation functionality that we are looking for. This will determine whether I use Fabric.js, which I had advocated in my proposal, or an SVG library - perhaps Snap.js.
Visual Annotations Specification
There are two types of annotations that I considered in my GSoC proposal: visual annotations (i.e. text, arrows, etc.), and rich media annotations - embedded images, videos from YouTube, or clips from SoundCloud. The first phase of my project is focused on basic visual annotations, so that's all I'm going to discuss here; rich media annotations will come later.
After looking through a lot of Public Lab maps, these are the core annotation features that I think are needed:
Place text directly on the map.
Users should be able to control the size, color, and orientation of text. The text should sit directly on top of satellite images, as in this example:

There's more on this in Mathew's research note from a few months ago: MapKnitter Annotations (GSOC).
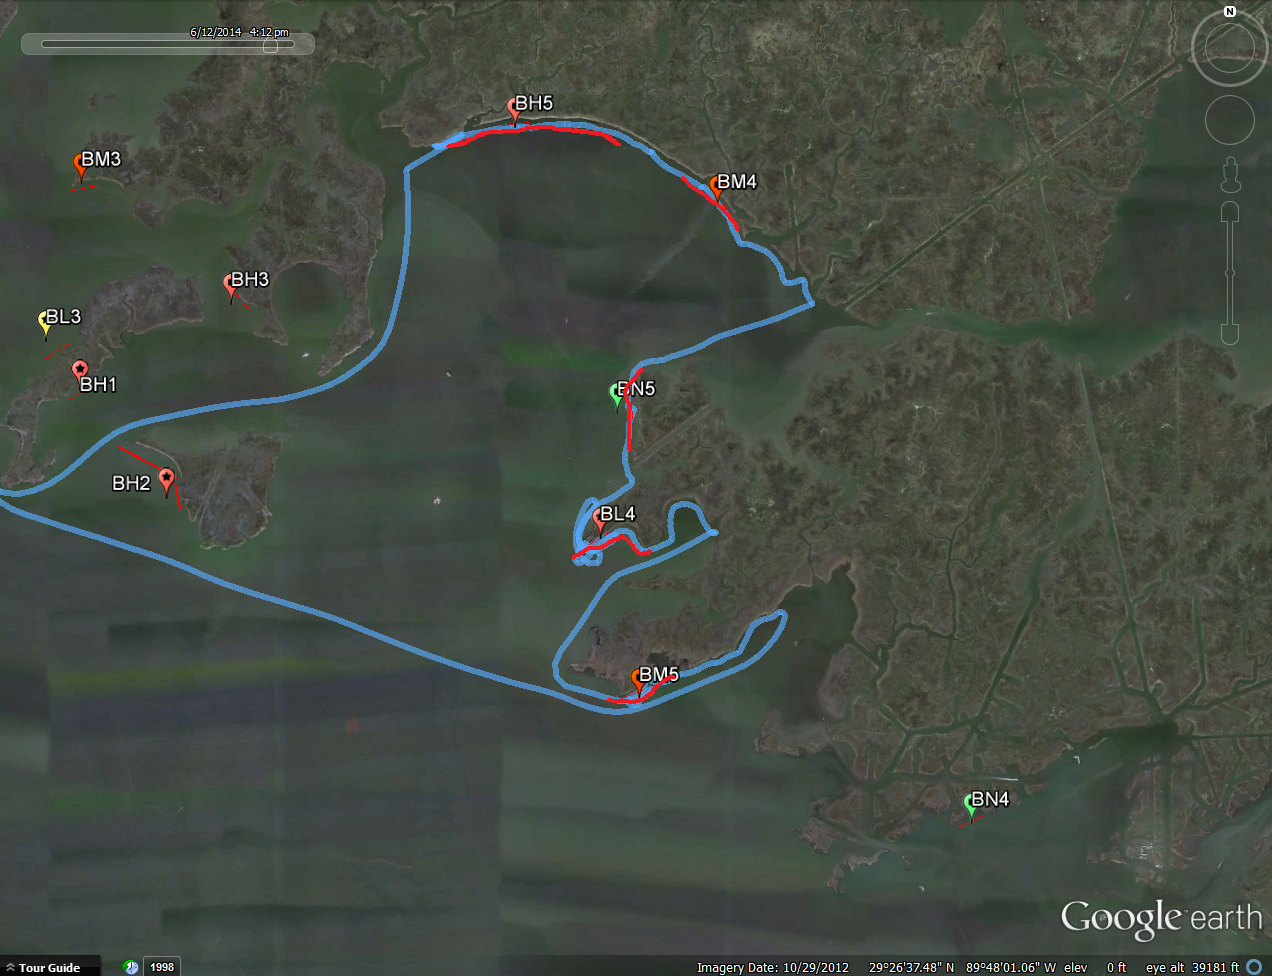
Draw small circles to act as markers and circular and rectangular outlines to frame an area of focus.
As above, users should be able to control the color of the shapes and the weight of the outline. Users should also be able to control whether the shape is filled or only an outline.
For example:

(from the From Lot To Spot Carbon Dioxide Mapping Project)
and:

(from eustatic's Bayou Manchac map of sewerage problem research note.

(from eymund's research note Exploring The Space Unseen: Historic Resources For Guiding Future Story Telling)
Draw freely.

Place tooltips/simple lines to indicate small landscape features.

(from the same research note Exploring The Space Unseen: Historic Resources For Guiding Future Story Telling).
Part of the idea behind placing text directly on the map is that this eliminates the need for a legend, because the integrated text does the job of the legend. However, there are some cases where a legend may still be desirable or necessary. It will be possible to make a legend using the above tools - rectangles, text, etc - but it might be worthwhile to create a dedicated legend functionality as part of the annotation tool.
Canvas vs. SVG
Most of the features above could be implemented using either vector graphics (SVG) or raster graphics (HTML <canvas> elements. I wrote in my GSoC proposal that I was planning on using Fabric.js, a Javascript library extending the HTML <canvas> technology, to implement the above features. However, I spoke to a software engineer at Inventables, which uses Fabric.js in their CNC milling software Easel, and he told me that Fabric.js has been frustrating for them to use - and that a lot of that comes from the fundamental nature of <canvas> elements.
One issue is that <canvas> elements are stateless. At any point in time, a <canvas> element is basically just a .png image. The only difference between <canvas> elements and images is that <canvas> elements can be dynamically written to using Javascript. Fabric.js adds an object-oriented abstraction layer on top of <canvas> and gives it a notion of state. But apparently (according to the engineer I spoke to, at least) - it's not perfect.
SVG has a much more natural notion of state. The disadvantage of SVG is that not all visual annotation functionality can be built naturally using SVG - for example, drawing freely is most naturally implemented using raster graphics, not vector graphics.
The performance of canvas degrades in proportion to the number of pixels that must be drawn (the size and resolution of the rendering area), while svg degrades in proportion to the number of objects. MapKnitter currently uses a combination of svg and canvas: Leaflet core uses <canvas> elements for rendering map tiles, but the Leaflet.draw plugin relies on svg. If a map is very large, then any naive <canvas>-based approach may run into performance issues. We could address these by lazily instantiating small canvas elements wherever a user clicks on the map with a drawing tool or by only allowing annotations within the bounding box of the uploaded aerial imagery (this could effectively solve any performance issues, since most MapKnitter projects describe a self-contained area).
Conclusions
Right now, I'm leaning towards using HTML <canvas> and Fabric.js, simply because it seems to be a much more natural solution to our annotation needs. However, I'm open to other suggestions - let me know in the comments! If I went with svg, I would either use the Snap.svg library, or just hard-code it myself, since svg has a natural object model.
If I go with Fabric.js, then the features in the above specifications will correspond to Leaflet bindings for:
Fabric.CircleFabric.RectFabric.PolylineFabric.Text
at a minimum.
Let me know what you guys think! Also - did I leave anything out of the visual annotations specification? I think that I covered everything that we need, but please let me know if I left anything out.
4 Comments
A discussion of performance and scene graphs in canvas vs SVG can be found here: http://unterbahn.com/2010/04/need-for-a-scene-graph-in-canvas/
Reply to this comment...
Log in to comment
I'll defer to Jeff on the technical questions of SVG vs canvas in browser. If we want to support the export of map annotations, SVG is a very nice portable format-- will working with it in browser simplify export?
other notes-- A legend feature is a great idea!
constraining annotations within the bounds of placed images would prevent people from annotating without/before collecting map imagery-- and pre-trip planning is one of our big community desires here. That won't work as a means of controlling system resources.
great writeup!
Is this a question? Click here to post it to the Questions page.
Reply to this comment...
Log in to comment
Great, thanks!
I spoke with Jeff today (today was the day that I went down to Somerville to meet face-to-face) and we concluded that given the annotations needs I detailed above and the performance profile of canvas vs. svg, it makes more sense to use svg. I'm going to take a look at the Leaflet.draw plugin to see if I can take it as a starting point. Since svg has a natural notion of state, there's less of a need for a high-level abstraction library, as there was with canvas, so I will most likely build the annotation tool using plain svg.
I didn't realize that pre-trip planning was something that people were hoping to use MapKnitter for - that's really useful info - thanks for passing it along!
Reply to this comment...
Log in to comment
Deleted some spam!
Reply to this comment...
Log in to comment
Login to comment.