NDVI stands for "Normalized Difference Vegetation Index". NRG stands for "Near-infrared / Red / Green". NDVI and NRG are both ways to visualize the amounts of infrared and other wavelengths of light reflected from vegetation. Because both these methods compare ratios of blue and red light absorbed versus green and IR light reflected, they can be used to evaluate the health of vegetation. It's a snapshot of how much photosynthesis is happening. This is helpful in assessing vegetative health or stress. (Read more here: https://www.agronomy.org/publications/jeq/articles/36/3/832) ## Do-It-Yourself These techniques for vegetation analysis were developed for satellite imagery, but at Public Lab, we've been working a lot on capturing infrared imagery using our DIY [near-infrared camera](/wiki/near-infrared-camera) setup, and combining it with visible bands to produce NDVI images such as the one above. ## What these images mean What exactly are these images we're trying to make? What do they tell us about vegetation, and why? These diagrams should help to understand what it is we're doing and why these are good ways to analyze plant life. ## The NDVI equation [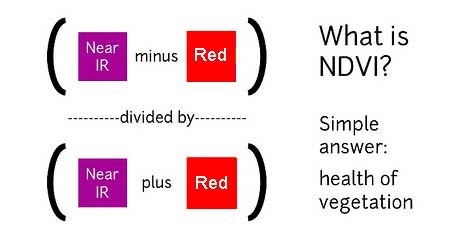](/i/44723) **NDVI = (Near Infrared - Red)/(Near Infrared + Red)** NDVI is a ratio which tries to emphasize photosynthesis while filtering out sun glare. The above equation is run for every pixel, using source data from an infrared photo and a visible light photo, like this pair: [](https://publiclab.org/system/images/photos/000/021/771/original/5390895115_c9d4d38fec_o.jpg) The result can be false-colored to make the high-photosynthesis areas more clear, and used to examine where plants are and how healthy they are. [](https://publiclab.org/system/images/photos/000/021/770/original/PetVISNDVIcomp.png) _Figure above: Normal color photo (right) and normalized difference vegetation index (NDVI) image (left). NDVI image was derived from two color channels in a single photo taken with a camera modified with a special infrared filter. Note that tree trunks, brown grass, and rocks have very low NDVI values because they are not photosynthetic. Healthy plants typically have NDVI values between 0.1 and 0.9. -- @cfastie_ ### Activities Here are a range of activities you can do to produce and interpret your own NDVI imagery, whether downloaded from a satellite imagery provider or [collected yourself using a DIY technique](/wiki/multispectral-imaging) [activities:ndvi] ****   Most DIY converted cameras today (those from Public Lab) use RGN instead of NRG, so the blue channel represents infrared instead of the red channel. That looks like this: [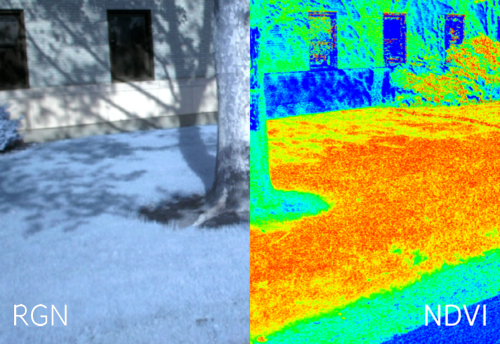](/i/45468?s=o) **** ## NRG imagery Some people are also interested in producing NRG imagery (like the below image), where `Near-Infrared, Red, and Green` are used to compose a picture instead of the usual `Red, Green, and Blue`. [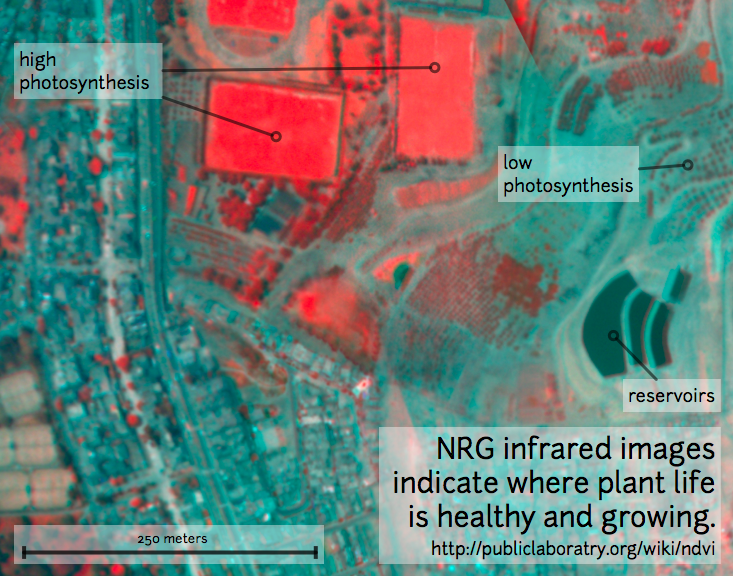](/i/25064) This diagram explains the swapping, which allows us to 'see' infrared as if it were a normal color: [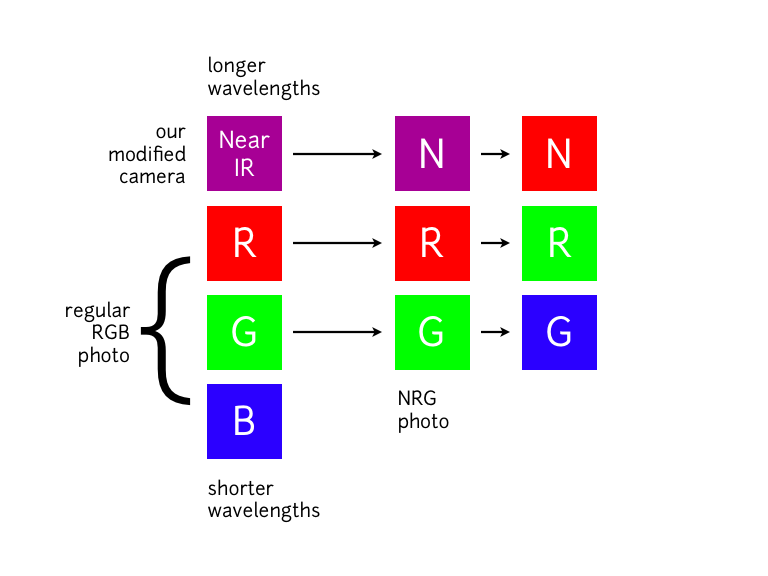](/i/25063) **In NRG images, the deeper and clearer the red color, the denser and healthier the vegetation (more or less).** ### Questions [questions:ndvi] ### Other examples of DIY NDVI imaging From around the internet: Begin watching at 2 minutes to see the resulting imagery: *This topic is part of the [Grassroots Mapping Curriculum](/wiki/mapping-curriculum) series.* **** [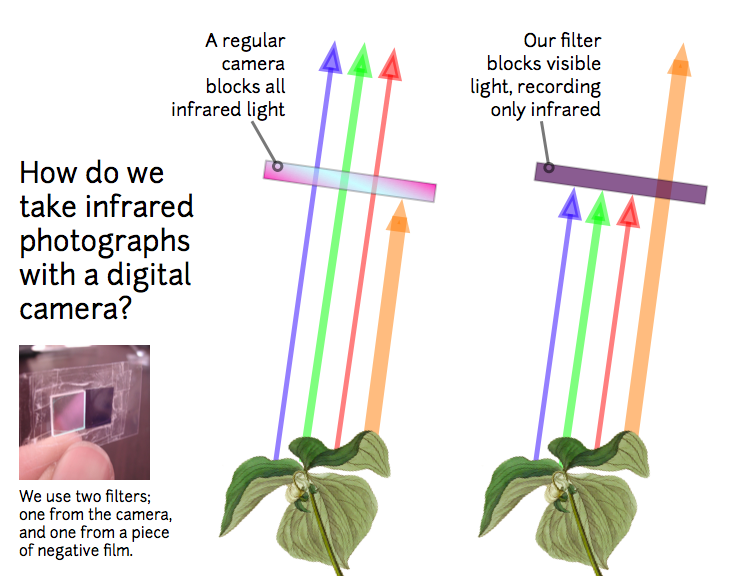](/i/25066) [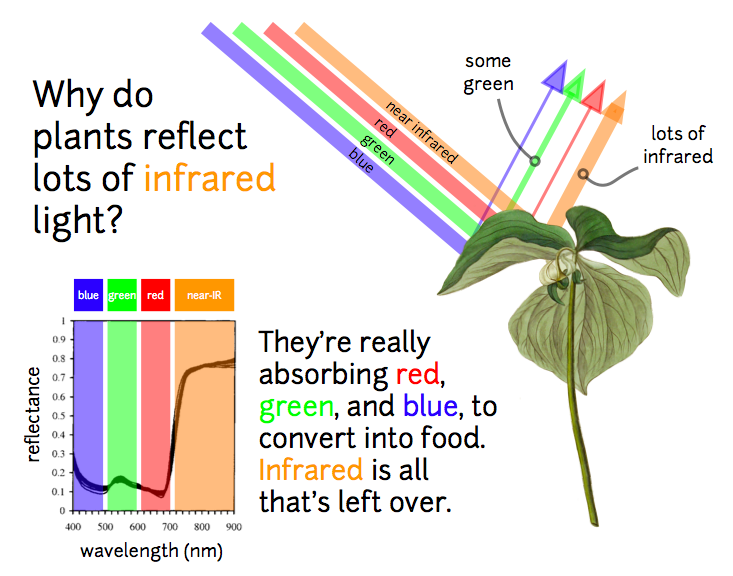](/i/25065) ...
| Author | Comment | Last activity | Moderation | ||
|---|---|---|---|---|---|
| warren | "I also updated http://publiclab.org/wiki/infragram#Filters with red/blue filter information. I believe all webcams are CMOS sensors so I'm not actu..." | Read more » | almost 10 years ago | |||
| warren | "The blurry photo looks interesting though... " | Read more » | almost 10 years ago | |||
| warren | "Hi natalie- it looks like the focus is a bit off... You actually don't have to remove the lens or anything to test this, you can just tape some red..." | Read more » | almost 10 years ago | |||
| cfastie | "This is a good question to ask on the Public Lab infrared discussion forum. Research notes. " | Read more » | almost 10 years ago | |||
| bc512 | "hey warren my infragram image is posted right at the top of the page in high quality if you would like to have a go " | Read more » | over 10 years ago | |||
| IntiE | "Hello, you can also play with the Digital Numbers focusing on the values you are interested (see histogram and min/max values), you can use many f..." | Read more » | over 10 years ago | |||
| warren | "Hi, can you post your raw Infragram image? So we can try? " | Read more » | over 10 years ago | |||
| bsugar | "Have you custom white balanced your Infrablue camera? http://publiclab.org/notes/cfastie/07-17-2013/balancing-act http://publiclab.org/wiki/infrab..." | Read more » | over 10 years ago | |||
| cfastie | "The NDVI image looks pretty good to me, but I don't know much about your process or expectations. Fill us in and we might be able to help (guidelin..." | Read more » | over 10 years ago |