I am trying to reproduce in Python the processing capabilities of the legacy (webGl) version of the sandbox, as they give the desired output. The processing pipeline is composed of a red channel normalisation (R/G) + NDVI preset (in color mode).

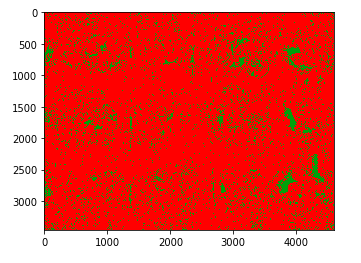
I managed to get a 100% identical picture after the R/G step, but the NDVI one is extremely bizarre. I tried applying the general formula and other variants for color/mono but to no avail. I also tried to follow all the steps detailed in the infragram.js from the same site but i only managed to get this:

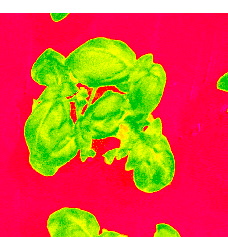
The legacy sandbox gives me a more detailed, softer output:
Could someone enlighten me about the formula behind that specific version of the sandbox? Thanks.
Ah, ok - would you mind linking us to the Infragram image, or uploading the original so we can try and compare ourselves? But for one, it looks like your python data may be rounded -- integer only! Could you try saving those as floats or decimals to see if you get more detail?
On Tue, Sep 11, 2018 at 9:16 AM \<notifications@publiclab.org> wrote:
Is this a question? Click here to post it to the Questions page.
Hi Warren, thanks for your suggestions! Unfortunately that's not the case: I convert the values for all three channels to float64 right when I split them.
Actually, I had a major breakthrough last night: the actual formula used in legacy (at least for my particular processing pipeline) is R-B, not the NDVI one. I managed to reproduce 100% the results on the legacy webgl one with this, but I'm puzzled at why does this happen. I saw no hint of this by looking at the javascript file (infragram.js) so could someone please explain what is going on? :D
Is this a question? Click here to post it to the Questions page.
Reply to this comment...
Log in to comment