
According to Pi documentation, a rolling shutter means that the camera reads the sensor one line at a time. This is a quality of most, if not all, cameras without a physical shutter.
For lights that flicker, e.g. fluorescent lights and LEDs that use pulse width modulation (PWM) for dimming, this can result in "banding" where the intensity varies as the camera reads down the sensor lines.
So aspects of the question are:
- How noticeable is banding when measuring flickering lights?
- Is banding reduced by using longer shutter speeds?
- Can this be balanced without overflowing the sensor at "normal" light intensities used in research?
- What kinds of measurements might this be a problem for, which types of measurements is it irrelevant for?
- If it's a problem, what are some solutions?
Possible examples of banding:
128155 - fluorescent bulb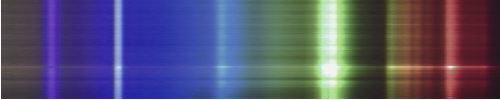
122557 - CFL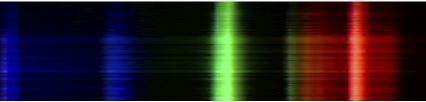
97106 - Calibration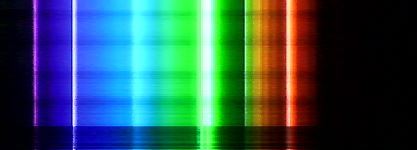
91584 - looks like a white LED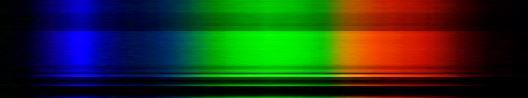
Is this a question? Click here to post it to the Questions page.
154520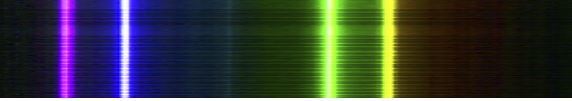
153053 - sunlight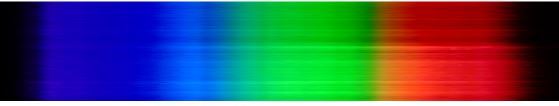 Since this example is sunlight, this may mean some distortions are attributable to factors other than the rolling shutter effect.
Is this a question? Click here to post it to the Questions page.
Getting the solar spectrum was a good idea. Clearly, the lines in this are not due to the light source and must be attributed to the detector. One question I would ask is whether the darker or brighter bands show up at the same row every time or whether they appear randomly. It looks pretty random in the figures, but I dont know how the data is processed.
It might be informative to see plots of intensity versus pixel number for representative rows. From the figures, it looks like the background (dark current from the detector) is significantly different in the different rows. I believe that thermal noise in the electronics could contribute significantly to the background. From the color plots you cant tell whether the entire spectrum is amplified or whether it is just the background. You also cant tell how the signal strength compares to the detectors saturation limit. That is another thing that plots of intensity versus pixel would let you evaluate.
Reply to this comment...
Log in to comment