What I want to do
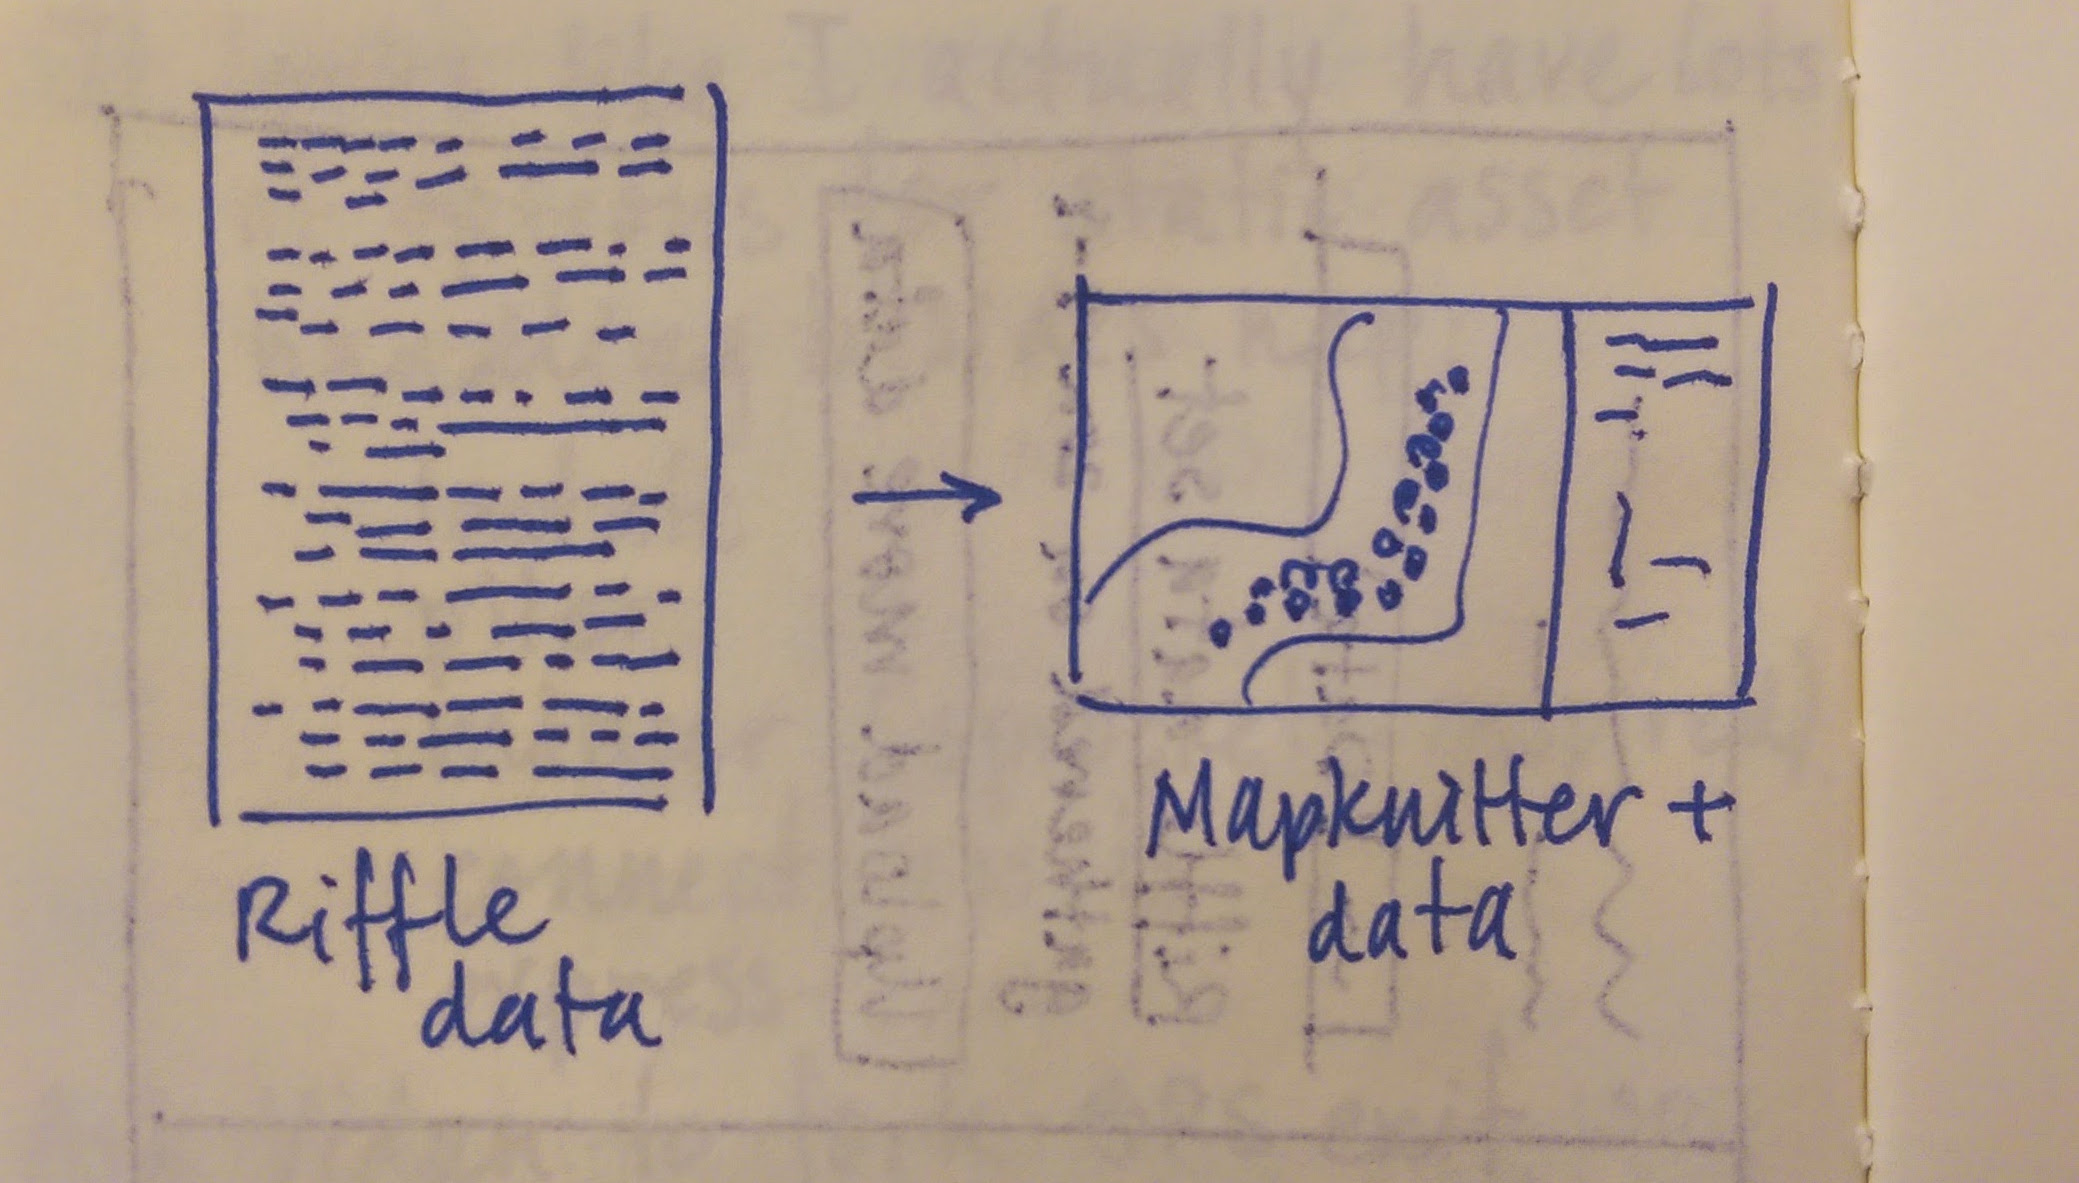
I want to have a discussion about how we might embed Riffle data in MapKnitter as map annotations.
@mathew suggested in this comment that it might be possible to embed Riffle data in MapKnitter maps - which I thought was an awesome idea!
I think that the goal here is to enable users to upload data directly from Riffle sensors and have that data displayed on or beside the map in a way that will substantively augment the information payload of the map.
What I've done
I looked around the Public Lab website and found some research notes that discuss or use Riffle data. In particular:
Wiki: Open Water Wiki: RIFFLE Kayak Deployment on 8-7-2014
Visualization by @WalkerJeffD Baseflow separation visualization
I also found a sample data set from a Riffle. [EDIT: Turns out that wasn't actually a RIFFLE data set. Here's a RIFFLE data set from @WalkerJeffD. It's much more manageable!]
There's a lot of data here. I don't think it's feasible or even desirable to want to present the data set to the users in raw form, or even to try to visualize all of the data. I think it would be nice if we could create templates that automatically visualized one or two key parameters from the data.
The workflow / processsing pipeline that I envision is:
- User uploads Riffle data set (the data set above is in
.tsv.format - Built-in templates display Riffle directly on the map - no "embedded" charts or graphs - using d3 and Leaflet.
- A link to the data set is added to the sidebar so that viewers can click through and see the full, raw dataset.

Next Steps / Additional Questions
The key question is: What default templates should we provide for visualizing the Riffle data? @mathew? @WalkerJeffD? @donblair? @warren? Let's start with a single data visualization. What is the data that will be most helpful to the most number of people? (I'm thinking maybe temperature plotted against location, as @WalkerJeffD has done here).
How flexible / extensible should this system be? Is it desirable to allow users to create their own custom visualizations using their own d3 and Leaflet code, or should we assume that users who are savvy enough to use d3 and Leaflet are savvy enough to do that kind of analysis on their own and publish it to GitHub, etc.
How much should users be able to customize the way that the data is displayed?
2 Comments
I think the most basic would be a blue-red location-stamped color dot for temperature, just like @WalkerJeffD put in his Kayak note, with some sort of legend option.
Most Riffle data is going to be interesting as an historical trend, and be fixed in a single point, so being able to scroll through data in some visuallly complelling manner would be great. A labeled time slider with a numerical readout? Is that kind of interactive object too complex?
Is this a question? Click here to post it to the Questions page.
Reply to this comment...
Log in to comment
Yeah, this is awesome, let's talk about this.
So first, the dataset you have up there is actually not riffle data. It was an example dataset that I was using to show some water quality viz techniques (before we even had a riffle to collect data with). So that data came from the Mystic River Watershed Association (MyRWA) using more 'traditional' sampling strategies (they go out with a commercial probe to measure temperature/conductivity, and they also collect samples in bottles that are sent to the lab for analyzing nutrients). So it actually has far more variables than the riffle (currently) measures.
But we now have real riffle data to use (yay!), so I think we should probably ignore that dataset (sorry if it was confusing being on the open water wiki page).
So there's basically two types of datasets that could be generated by the riffle.
So one thing to note is that the riffle does not collect GPS coordinates itself, so the data file that we download from the riffle only has the timestamp and sensor readings. For the kayak deployment, I used a separate arduino with a GPS shield to log my location as I paddled around. So I had two files, one from the riffle, and one from the GPS. Then in my analysis write up, I merged the two based on the timestamps. So if its useful, I can spit out a single dataset that has the riffle data combined with the lat/lon, which you could use for the map.
If you want to just work with temporal data (at a fixed point), you could start with the cambridge deployment data, which is here, see Riffle1 and Riffle2 cause we had two riffles at the same location. Riffle 1 we trust more, but Riffle 2 had conductivity. These were both located at a USGS gage, so you can get the lat/lon from this USGS page.
@donblair and I are working on a new website that will be hosted on github where it'll be easier to find and download all of the riffle data. sometime in the future we're planning to have a web-based database with API so you could (in theory) connect mapknitter to the riffle database directly. but this is a ways in the future. for now, just try using those csv files.
@donblair - we should probably update the open water wiki page to add some real riffle data now that we have it.
Is this a question? Click here to post it to the Questions page.
Reply to this comment...
Log in to comment
Login to comment.