Hi everyone! I'm Joaquin, from Buenos Aires and I am collaborating with the Aerocene project on visualizing flight paths trajectories. We have developed instructions on how to record and visualize a balloon's trajectory that might be of interest to the Public Lab crowd:
- Signatures in the air
- From Handheld GPS to Google Earth - A conversation about how to visualize an Aerocene's trajectory
Feel free to join the conversations, ask any questions or contribute knowledge!
6 Comments
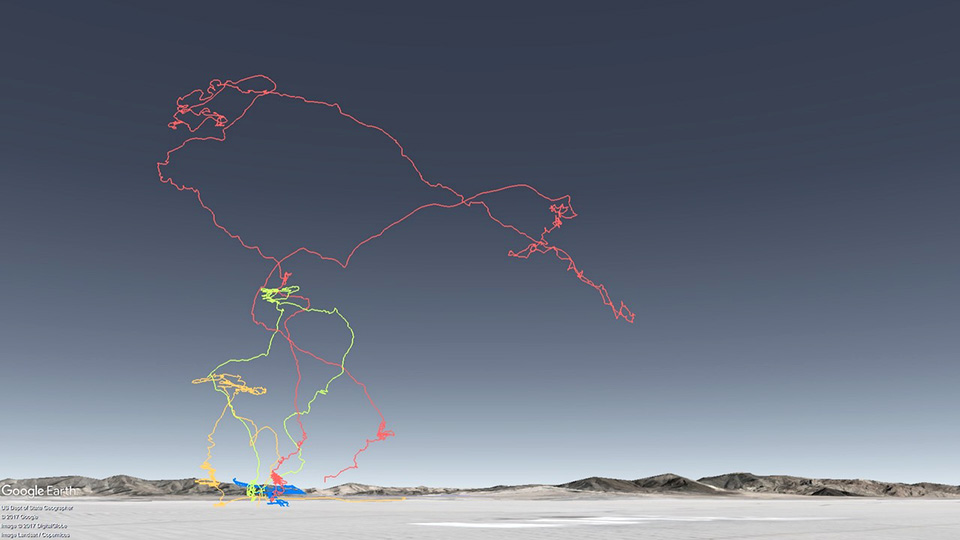
Beautiful work @joaquinx ! are the four different color trajectories in the image different balloons or different launches from the same balloon? what do you think accounts for the difference? just curious :)
Is this a question? Click here to post it to the Questions page.
Reply to this comment...
Log in to comment
@nshapiro Hi Nick! Four different balloons. Note of interest, the highest flying balloon cord length was double the other ones. In the future we could tie trajectory color variation to a magnitude like temperature or air quality like @cfastie has done here: https://publiclab.org/notes/cfastie/06-02-2016/soaring-riffle
Reply to this comment...
Log in to comment
ah! great, thanks Joaquin! that is what I assumed about the red 'signature'! as the height seemed about double the green. my condolences to the blue balloon :) yes @cfastie I remember when i first brought that research note over to the studio in Berlin and everyone got really excited. you've inspired a lot of aerocene work, chris!
Reply to this comment...
Log in to comment
It's really good to see these flight trajectories. I think it's an important way to document a flight.
I have not been able to figure out how to make a KML file that displays each segment of a route with a color determined by a variable like temperature or humidity. It would be great to learn how to do that so Google Earth can display our flight trajectories with environmental data. I have lots of data from the SkyPod Data Logger with lat, lon, alt, temp, humidity, and pressure in a csv file with timestamps. Let me know if you figure out how to display one of those variables as colors in Google Earth.
Chris
Reply to this comment...
Log in to comment
@cfastie Hi Chris I've researched quite a bit and haven't found any references to lines with varying colors following a variable for the KML language. Thanks to @nshapiro I know It's definitely possible with Cesium -cesiumjs.org-. I will be looking into this in the future and will get back to you if I make progress. It's just JavaScript so it shouldn't be too hard. Few examples: https://cesiumjs.org/demos/spedmo/ https://cesiumjs.org/demos/ParaglidingLogbook/
Reply to this comment...
Log in to comment
@joaquinx thanks so much for joining us today at OpenHour! It was great to hear an update on this project
Reply to this comment...
Log in to comment
Login to comment.