SmART-FORM Badge Lighting Analysis Experiments
We are currently developing a smartphone app that can be coupled with a color-changing badge to measure formaldehyde concentrations in homes. Formaldehyde is a carcinogen and irritant commonly found in the indoor environment. The SmART-FORM application can be paired with a colorimetric badge to detect concentrations of formaldehyde indoors. Users will go into the application and take a picture of the colorimetric badge (Figure 1) and then any change in color on the badge will be analyzed to determine formaldehyde concentration. First, we needed to determine the most ideal lighting conditions in which to take a picture of the badge. Through experimental procedures it was determined that a 25W or 40W non-LED bulb using fixed or auto camera settings from the phone itself provided the most ideal conditions for taking images of the colorimetric badges. This is described below.
Experimental setup
 Figure 1. Sample colorimetric badge where the left half is used for calibration and the right half changes with formaldehyde
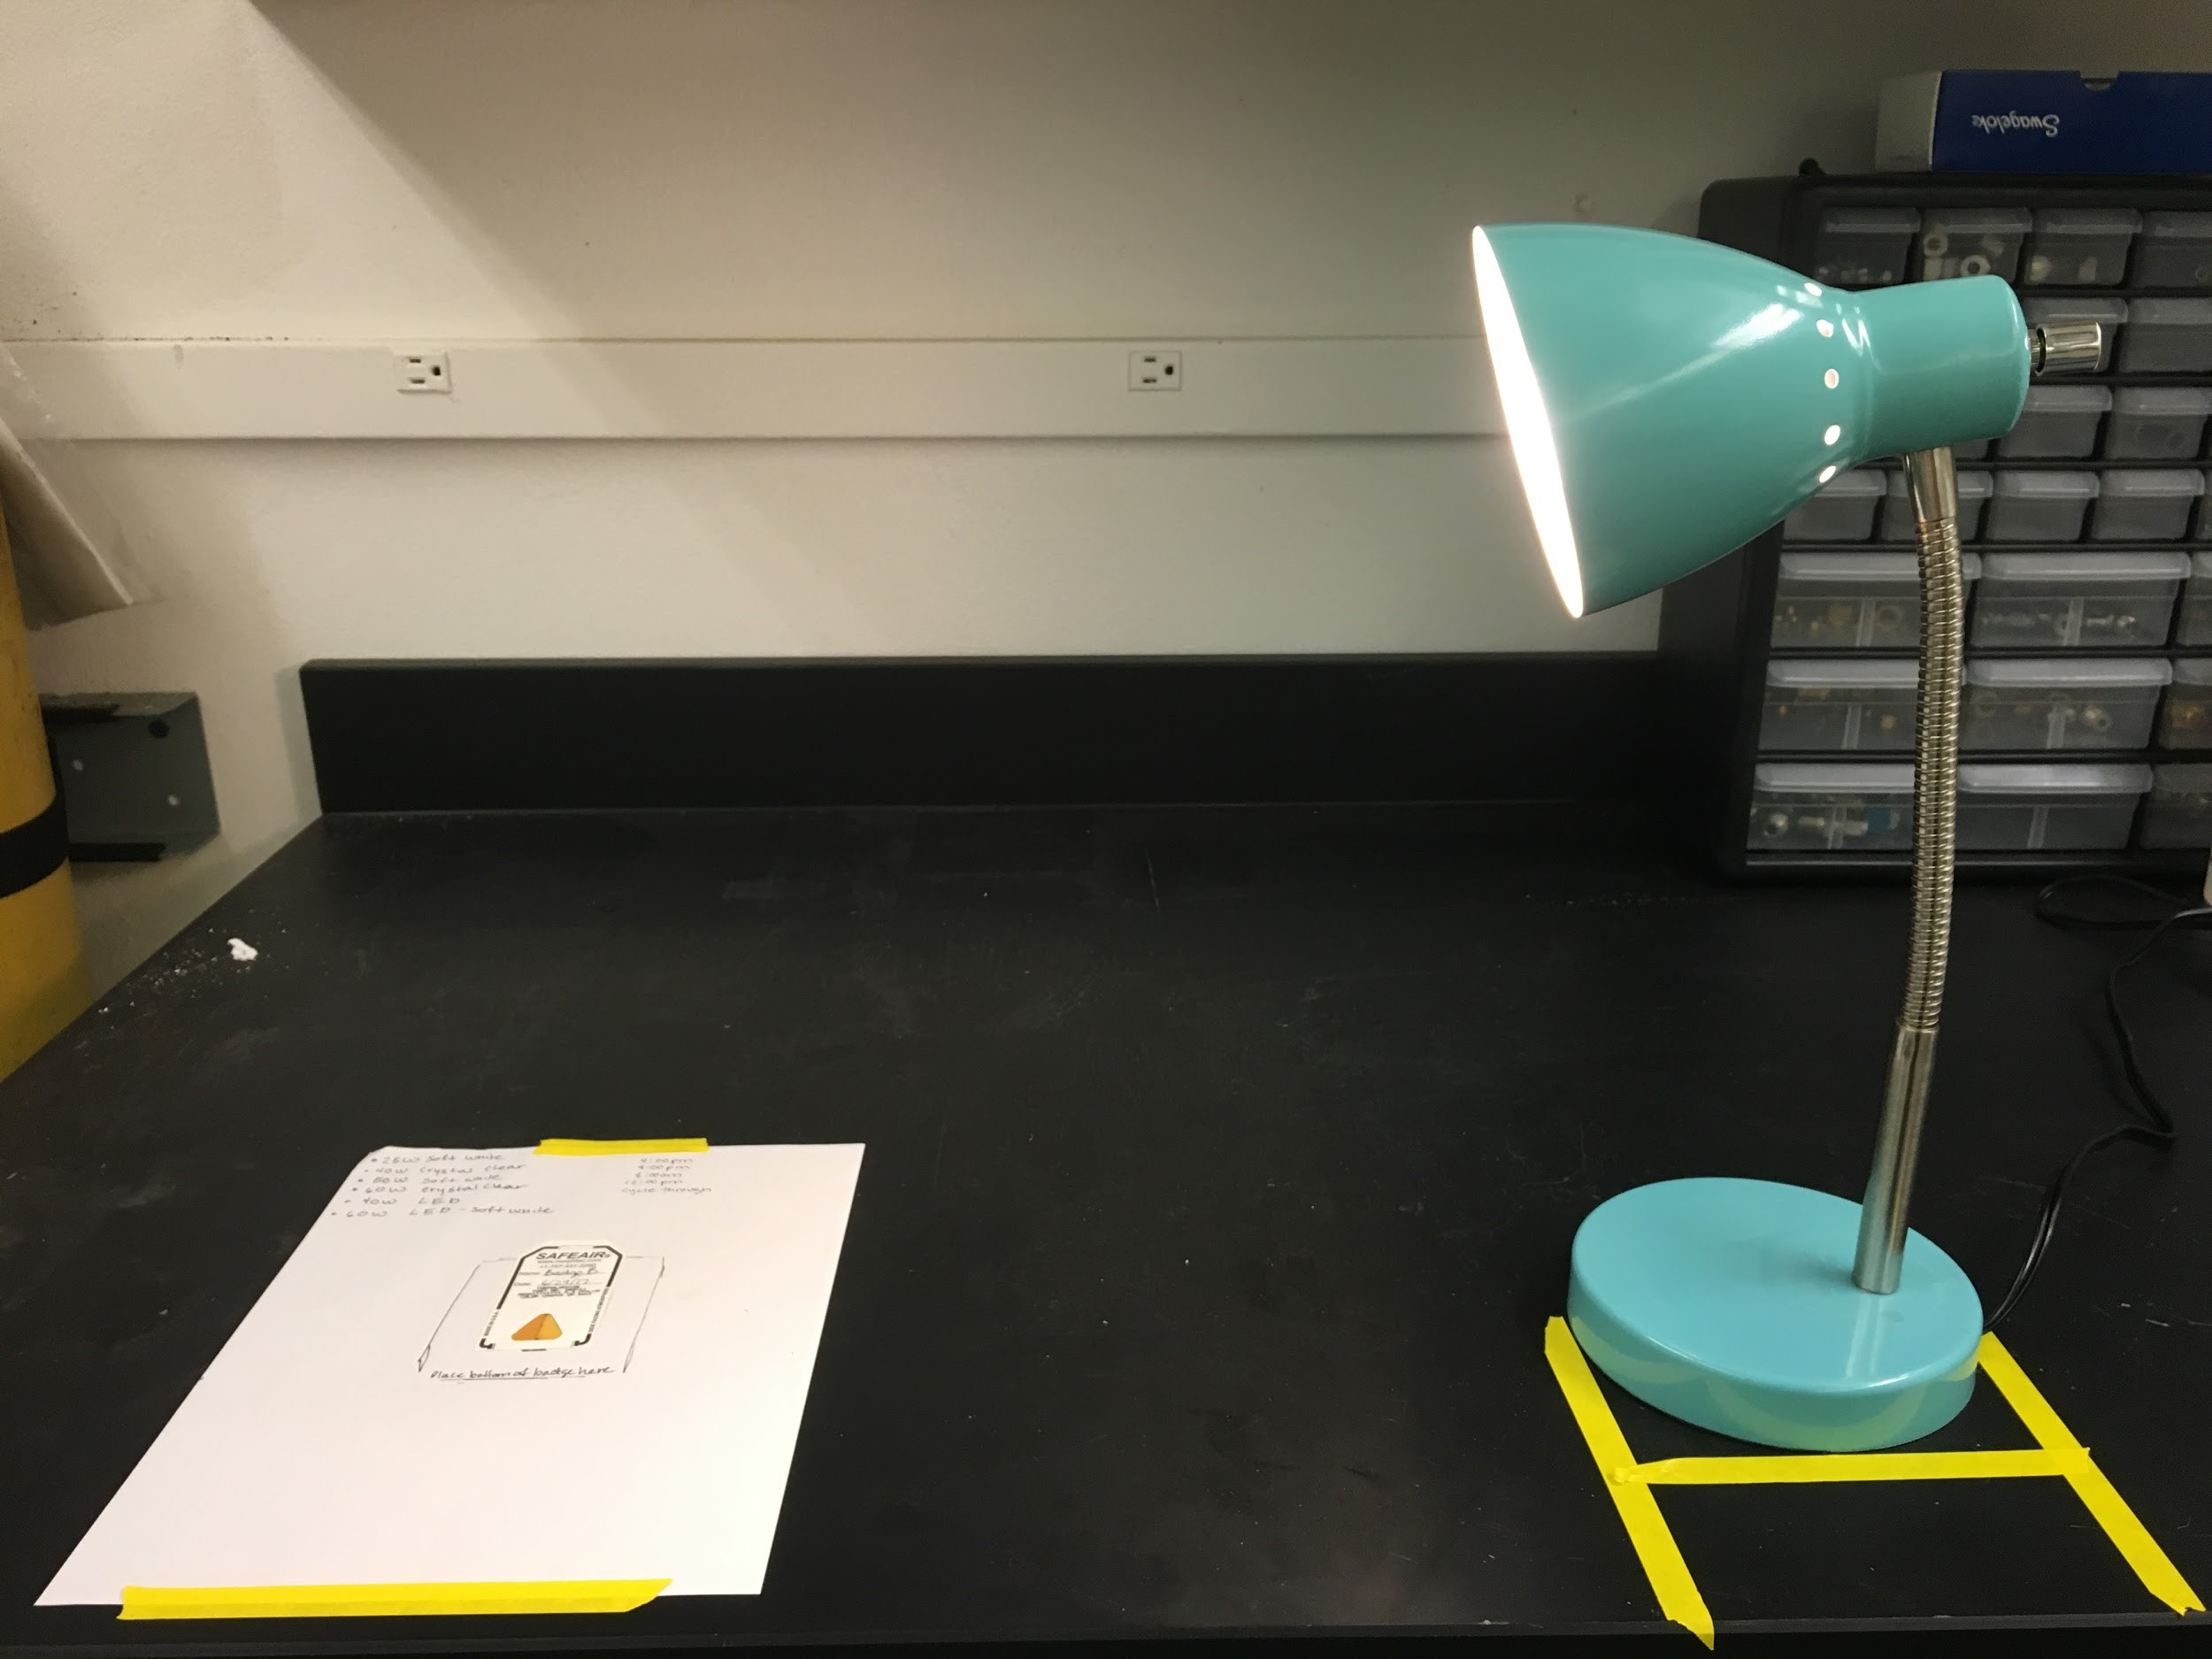
When developing this application, we needed to take clear images with no shadows and correct color composition. We also wanted to test the accuracy of the auto camera settings on the iOS and Android phones and if creating our own mix of settings would be more reliable. To do this we purchased different types of lightbulbs and a desk lamp, setting up the lamp about 12in from the badge with the lampshade titled slightly down (Figure 2). In these positions shadows covering the badge when taking images were avoided. The types of lightbulbs purchased were: 25W Soft White, 40W Clear, 40W LED, 50W Soft White, 60W Crystal Clear and 60W LED Soft White.
 Figure 2. Lighting experiment design with the lamp roughly 12in from the designated badge placement position
From 6/26/17 - 6/29/17 images of a detection badge were taken with customized iOS camera using each light bulb about every 4 hours. At each time point the badge was removed from the chamber and placed on the designated spot next to the lamp. The light bulbs in the lamp were then replaced so an image of the badge could be taken using each light bulb. The IOS version of the app had specific camera conditions set as seen in Figure 3. These were set before the experiment began and images were taken at these settings using different light bulbs.
 Figure 3. First iOS camera settings.
After each image was taken they were imported into Matlab and cropped by reaction area and calibration area. These cropped bitmaps were converted into HSI (Hue, Saturation, Intensity) color model, and the means of color intensity (I) were calculated as mean_react and mean_calibrate. The ratio was calculated by dividing mean_react and mean_calibrate, and a trend of decreasing ratio with increasing time was expected.
The Results
From this analysis it was determined that the lower intensity lightbulbs of 25W and 40W worked better at these camera settings. They showed steeper slopes and smaller variations as seen in Figure 4, which is likely due to camera overexposure under bulbs of lesser wattage. After this test we decided that further work must be done with the iOS camera settings to determine how the camera settings would affect the results. Four settings were tested using special color grid paper (Figure 5). The highest and lowest watt bulbs used in this experiment were 60W and 25W.
 Figure 4. Badge readings over 64 hours using 25W, 40W, 50W, 60W and 60W LED
 Figure 5. Color grid paper
The color grid paper is captured by the camera under three different manual settings and auto adjust. The orange block and the yellow block are picked up and converted to the HSI color model. The ratio is calculated by dividing mean_orange and mean_yellow. The reason to choose the color grid paper instead of the actual badge is that the printed color will not change, thus providing a good reference to determine the influence caused by the camera settings.
Figure 6 shows that the ratio of color intensity between “orange” and “yellow” is quite stable with different camera settings under 25W, while the results of 60W show more variations. The variations are possibly caused by overexposure as well, so the ideal camera settings should eliminate such overexposure.
 Figure 6. Color readings over different camera settings using 25W and 60W
Conclusions
Our experiment showed that it is best to use a 25W or 40W non-LED light bulb, and set up the fixed camera settings, White Balance: 4000K, ISO: 200, Exposure Duration: 1/60s or 1/125s depending on the light bulb, to avoid any overexposure. In addition, we plan to use the app to detect overexposure in the images and warn the user, allowing them to take a better picture for more accurate results.
Contributors to this lighting portion of the project and blog post: Sarah Haines, Siyang Zhang, Gretchen Gehrke, Nick Shapiro and Jessica Castner, Rongjun Qin, Karen Dannemiller
3 Comments
@liz awards a barnstar to haines241 for their awesome contribution!
Reply to this comment...
Log in to comment
Kodus! https://www.sciencedirect.com/science/article/pii/S0360132318307248
Reply to this comment...
Log in to comment
your google alerts game must be strong @amirberAgain :)
Reply to this comment...
Log in to comment
Login to comment.