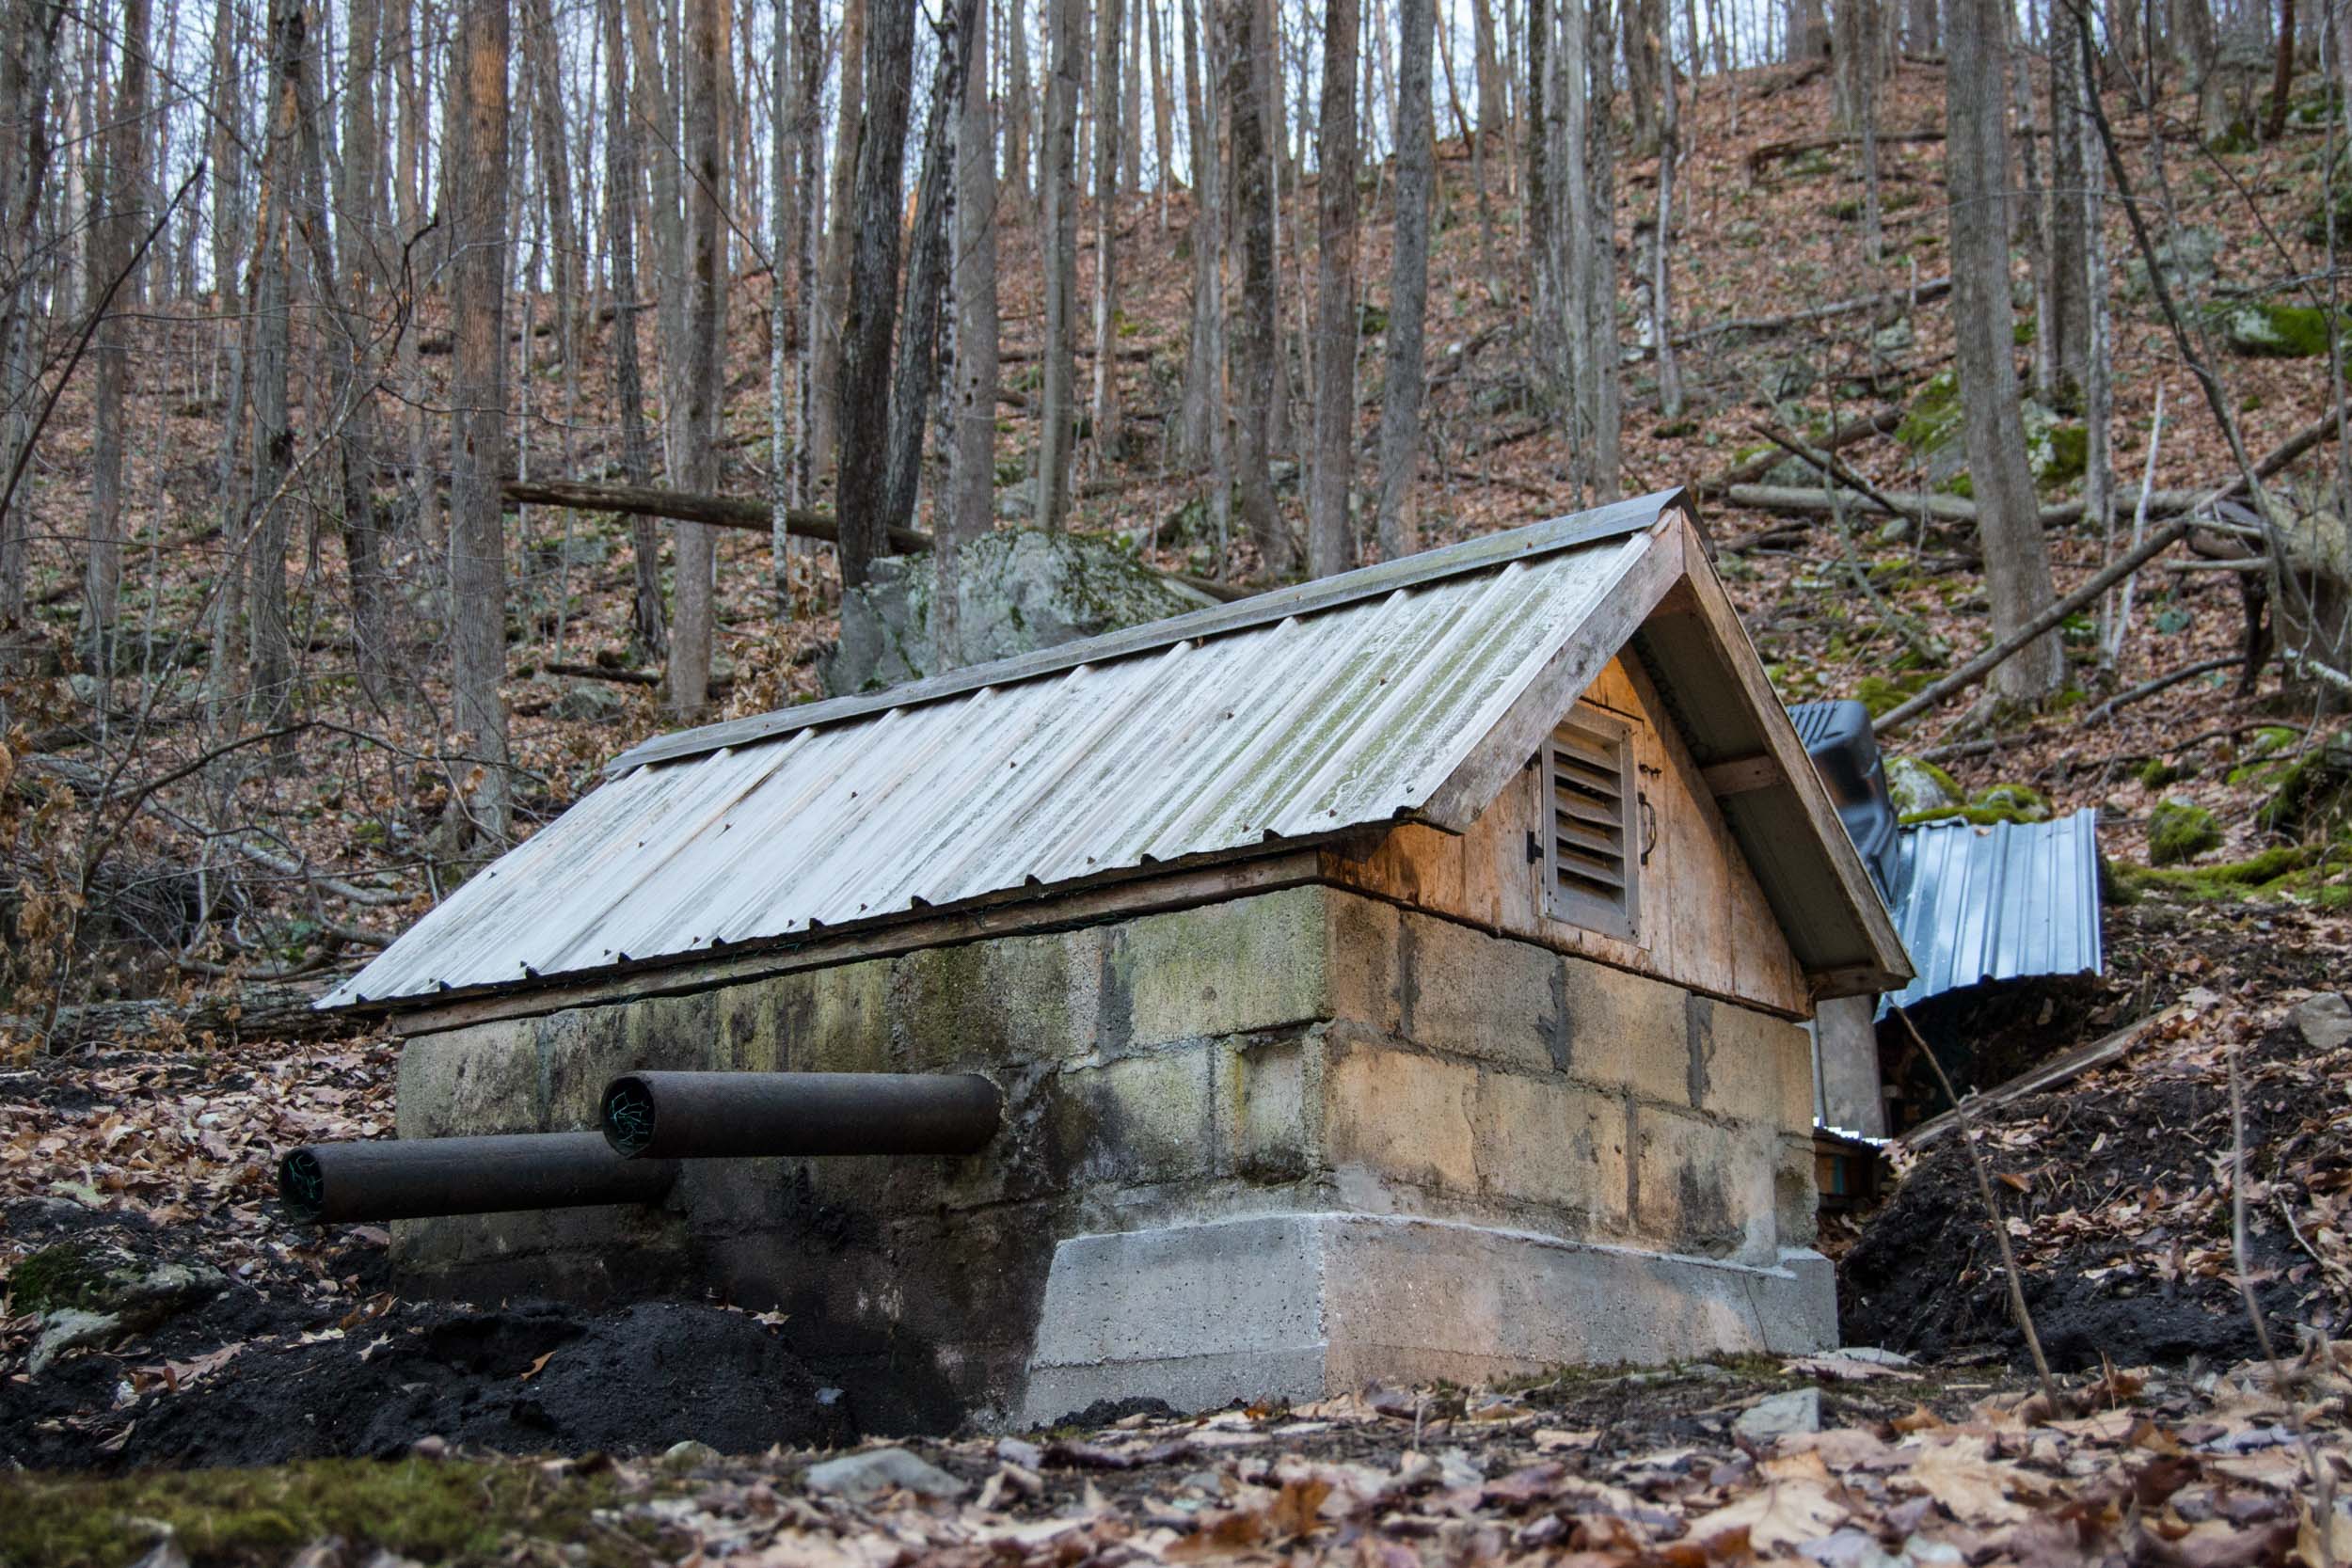
Above: My newly renovated springhouse. I have not seen water exiting the overflow pipes in several years, but my repairs could make that more likely.
I get my drinking water from a spring in the woods behind my house. I modified the springhouse this fall to strengthen the separation between the groundwater that collects in the springhouse and rainfall or surface runoff that tries to sneak in. I have always wanted to know how much rain or runoff gets into the springhouse and I think monitoring the water level might tell me. If the level always rises immediately after (or during) a rain or snowmelt event, that suggests that either the springhouse leaks or is fed by very shallow groundwater.

Figure 1. The inside of the springhouse. The current water level is about 24 inches below the top of the concrete blocks, and it is 55 inches deep. The level could fluctuate about 30 inches, but I have never paid much attention to how the depth changes. Stitched from 20 photos.
Sparkfun sells an eight inch ruler that you dip in the water and it senses how much of the ruler is submerged. But it costs $40 and the water level in my springhouse fluctuates more than 8 inches. Don Blair tried a different system with just a piece of wire, so that might be an option. I have a bunch of $2.00 to $5.00 sensors for temperature, humidity, barometric pressure, light, sound, and acceleration. I assume each of those could be used to measure water depth (great idea for a hackathon). Although I had never used the accelerometer and didn't really know what it measured, I decided it was my best bet.

Figure 2. An I2C sensor breakout PCB with a MMA8451 3-axis accelerometer chip on it. The board is 2 cm long. What this thing does is completely indistinguishable from magic. I costs less than $2.00 on eBay (delivered). I screwed it firmly to the wooden arm so its Y-axis movement would be the same as the tilt of the arm.
Accelerometers measure motion and the one in your phone can be used by apps like Physics Toolbox or MyTECH to measure the height of tall buildings from inside the elevator. When accelerometers are not moving and would seem to have nothing to do, they do the coolest thing of all. They can tell which direction gravity is pulling on them (and trying to make them accelerate). So if the accelerometer is tilted, it knows the angle of tilt. I learned this by connecting my $2.00 MMA8451 accelerometer to a Nano Data Logger and watching the serial monitor as I tilted the sensor. A piece of silicon was telling me which direction gravity was coming from even when I made it stand on its head. This is my favorite sensor yet.

Figure 3. The conceptual diagram which is directing my current efforts. The data logger and battery will be in the bottle at the top. I did a poor job making the vertical and horizontal scales the same.
So here is the plan. If one end of a long arm is on a raft floating in my springhouse, and the upper end of the arm is hinged so the arm can tilt freely, then the angle of the arm is directly related to the height of the water surface. If the accelerometer can tell me how much the arm is tilted, then the Arduino can use math to tell me what the water level is.

Figure 4. The proof of concept setup. Can a $2.00 accelerometer on the tilting wooden arm tell me how high the end of the arm is above the floor?
To see if the MMA8451 was good enough to do this, I made a mock up with a wooden arm about as long as one that would fit in the springhouse (Fig 4). I attached the upper end of the arm to the handle of a tripod head. The lower end could move freely up and down as the tripod head tilted. I firmly attached the accelerometer to the arm, along with the Nano Data Logger and battery pack (Fig. 5). In the real deployment, the data logger and battery would not be on the arm, but that was easiest for this test.

Figure 5. The accelerometer (far left) is attached to the wooden arm and wired to the Nano Logger.
The sketch running on the Nano (attached below) captured data from the sensor once per second for ten seconds, computed the mean, maximum, and minimum for those ten data points, and wrote those results to the microSD card. It then waited 10 seconds so I could move the arm to another position. An LED blinked every time the sensor was read so I could keep track and be ready to move the arm when the sensor was not being read (Fig. 6).

Figure 6. A green LED (upper right) stopped blinking when it was time for me to move the arm to a new position. The long blue thing is the Arduino Nano on a data logging shield.

Figure 7. I mounted a metal ruler vertically with clips every two inches. The very end of the wooden arm rested on a clip for each sequence of 10 sensor readings. The whole ruler setup had to be slid across the floor a little bit for each new measurement. The Nano Logger recorded data for the carpet (0 inches) and every two inches of height above the floor up to 32 inches.

Figure 8. The raw data from the calibration measurement series. This is the time course of the test. I moved the end of the arm two inches higher every time, so the x-axis here could also be height above the floor in two inch increments. I have not yet figured out what the units returned by the sensor are. Does anybody know?

Figure 9. These are the same data as in Figure 8, but when graphed this way, Excel will fit a curve ("trendline") and display a polynomial regression equation. This equation can be used to estimate the height of the end of the arm for any accelerometer reading within this range. To use this equation for that, you have to ask Excel to show more significant figures in the coefficients (right click on the equation, "Format Trendline Label," Category, Number).
The results from the calibration data set are promising (Fig. 9). To find out how accurately I might be able to measure the height of something (or the level of a water surface) with this contraption, I ran the sketch on the Nano Logger while resting the end of the arm on several arbitrary things of known height (Figs. 10-11). I also rested the arm on the carpet to measure zero height.

Figure 10. The arm resting on a bayonet (for US 1901 Krag rifle from Spanish American War era), and three other objects used to create the validation data set.

Figure 11. The arm resting on a 24" long layout grid. Its 6" width was also measured.
I interspersed the different objects haphazardly so the Nano Logger recorded 10 sensor readings of the height of one object and then recorded one of the others. I also moved the entire setup to a new location twice to see how sensitive it was to a different position, to disturbance, or to being powered on and off. Each of the seven heights was measured (10 sensor readings) several times. The Y-axis sensor readings (means of 10 readings) were plugged directly into the equation from Excel to compute the height above the floor in inches.
I was pleased with the result of the validation data set (Table 1). It seems that this system has the potential to consistently measure height to within a third of an inch, with a mean error of 0.14 inches (3.6 mm). This is probably plenty of accuracy and consistency to allow me to learn what I hope to learn about the water level in the springhouse. Now I just have to figure out how to get that tripod in there.

During this week's Public Lab Open Hour on data logging we discussed using Arduinos for student science projects. Working with an accelerometer for the first time has confirmed my opinion that an Arduino and a $2.00 sensor will surprise us with what it can do and with its excellent teaching potential. I have already outlined in my head an entire middle school course with students using this one sensor.
I used data from only one of the three axes reported by the MMA8451, and only when it was not moving. So middle school students might benefit from an exercise like the one I did, and physics and calculus students will have plenty to do when all three axes of a moving sensor are considered. The most creative applications of this device will be when it is used to learn about something other than the device itself. How fast is something moving (an animal, a plant growing, a tree in the wind)? How often is something moving (pet food tray, treadle on wildlife trail, sunflower head)? How much is something tilting (freezing soil, flowing stream, chest of a breathing patient)? The possibilities are endless.
To convert the accelerometer data into height measurements I used a brute force method of regressing raw data on known heights. High school students could also use trigonometry to solve for an unknown side of a right triangle so no calibration data would be required--just do the math to convert raw accelerometer data into water level height. When I get this contraption installed in the springhouse I will need a new calibration, and the brute force method won't work very well with all that water around. But I will know the exact length of the arm and the accelerometer will know its angle. I might need a student to help me with the trigonometry.
An important feature of this device for educational purposes is that excluding the tripod, wooden stick, and batteries, the parts cost less than $15.00 on eBay.
0 Comments
Login to comment.