
Image above: Close up of some terbium and europium emission peaks in the spectrum of a compact fluorescent lamp photographed with a Nikon D40 DSLR. Terbium and europium compounds are commonly included in the phosphors lining the inside of fluorescent tubes. The overlain spectrograph is the red channel extracted by Spectral Workbench. The flattened top of the tall peak indicates that the red channel was overexposed preventing precise assignment of a wavelength to that emission peak.
Introduction
The PLOTS spectrometer is designed to stream video from a webcam or smart phone to Spectral Workbench which makes it easy to transfer the data and analyze it. But I don't have a good webcam or Android phone (streaming does not work on iPhones yet), so I have been capturing still photos and hoping that they provide crisper images and maybe better data. Spectral Workbench allows still photos of spectra to be uploaded, which works well.
My spectrometer is a little different from the standard PLOTS model because I made changes to all three of its components. I made the entrance slit narrower by about half (about 0.2 mm), I used 1000 lines per mm diffraction grating film instead of a piece of DVD, and I used various cameras instead of the webcam that the PLOTS desktop model shipped with. But the basic design is the same: I make photographic images of the spectra created when a thin band of light passes through a transmission diffraction grating.
I hope to make a new version of the spectrometer that is portable like the smart phone version, but uses a point and shoot camera to capture still photos of the spectra. To use it I will have to do the extra steps of transferring the photos to a computer, cropping them, and uploading them to Spectral Workbench, but the subsequent analysis will be the same.
Methods
To figure out which camera to use for my spectrometer, I tested seven different ones, three of which I use for aerial mapping photography. I tested one webcam (Microsoft LifeCam VX6000), but not the one that comes with the PLOTS spectrometer, which I think is better than mine. I tested two smart phones and one real camera, a Nikon DSLR with a good macro lens. I captured an image of the spectrum of a compact fluorescent lamp trying to get the crispest image possible with good detail of faint spectral features, but without overexposing the bright peaks. I tried different combinations of light sensitivity (ISO), zoom level, f stop, shutter speed, and white balance. My tests were not very scientific because my setup did not allow me to maintain the exact same spectrum displayed by the spectrometer while I switched the cameras one by one. So the images below vary in part because the spectrum itself varied or because the exposure varied, but the differences are still revealing. I took many photos with each camera, and the best ones are below.
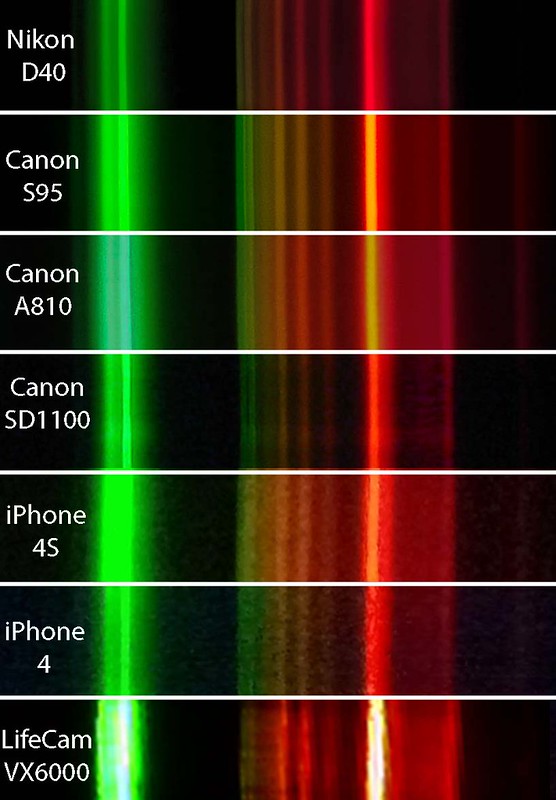 Part of the spectrum of a compact fluorescent lamp taken by seven different cameras.
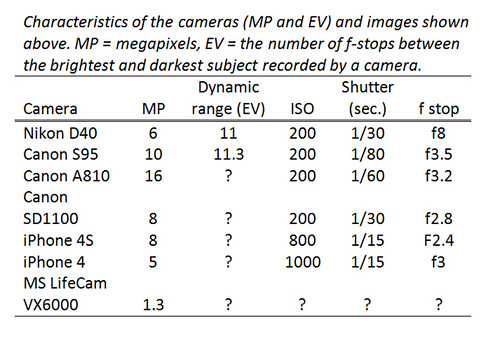
Results
Sensor size. An obvious result is that better cameras take better photos of spectra, and much of the difference is probably related to the size of the camera's sensor. Larger sensors are more sensitive to light, and the spectra we are trying to photograph are dim. Cameras with small sensors, like webcams, smart phones, and low end Canon Powershots, do not perform well with low-light subjects. They can capture images of dim spectra, but the images are grainy, and the black areas are not very black. This introduces background noise into the spectral data. The grainiest of the images was taken by the iPhone 4 which reported it was using ISO 1000, a fast setting that guarantees poor quality. There was no way to force the iPhone to use a slower ISO setting, but even if there was that would have required the shutter to be slower or the aperture to be bigger, and both were already at their limit. So the low sensitivity of smaller sensors affects image quality in multiple ways -- it requires high ISO which increases graininess and it forces the camera to use a slow shutter speed and sometimes the widest aperture (f stop) both of which can degrade image quality. There is a big difference in sensor size (and sensitivity) among the cameras tested and this probably explains a lot of the differences among images.
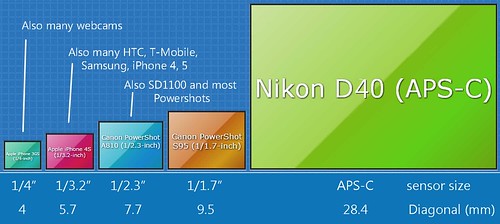 Sensor size for the cameras I tested. I don't know the sensor size for my webcam, but it is probably the tiny 1/4" type. Image quality and low-light performance are generally a function of sensor size. The figure is (probably) not actual size.
Exposure. Another problem with cheaper cameras is that there is limited control over exposure. It is important to expose well for the bright parts of the spectrum. If they are overexposed this truncates the peaks and makes determining their exact wavelength impossible (see topmost image). Left to its own devices a camera's automatic exposure will average the scene of bright spectral lines on a black field and overexpose the peaks. DSLRs and the better Canon Powershots have a true manual mode so you can get exactly the exposure you want, but most Powershots, phone cameras, and webcams rely solely on automatic exposure. CHDK running on a cheap Powershot allows complete control, and some smart phone apps at least let you expose for a selected part of the image.
Dynamic range. Even if you get a good exposure, cameras with small sensors will have a hard time recording detail in both the brightest and faintest peaks. Dynamic range increases with sensor size and quality, so better cameras will be able to avoid overexposing (and truncating) the brightest peaks while simultaneously recording the faintest peaks which are lost in the dark background in images from other cameras. In any one camera, dynamic range decreases at higher ISO speeds, so: A smaller sensor leads to low sensitivity, which leads to high ISO, which leads to graininess AND lost bright and dim details. A feature of many recent cameras, including phones and Powershots, is HDR or high dynamic range. This feature takes multiple photos at different exposures and blends them into one image preserving the brightest and dimmest parts of the scene. Especially if the spectrometer is held rock steady, this can improve the range of peaks recorded in a spectrum. However, the relative brightness of spectral peaks is important data when identifying the composition of a material, and HDR modifies the natural relationship among peaks in ways that might compromise interpretation.
Conclusions
The Canon Powershot S95, my best Powershot, has good dynamic range and complete manual control of exposure and focus. I would rather use a cheaper Powershot because then I would be willing to open it up and remove the infrared block filter. That would allow recording spectral peaks in the near infrared region and extend the scientific usefulness of the spectrometer. But that makes the camera useless for regular photography. I don't want to do this surgery on my S95, but I also don't want to accept the lack of manual control in a lesser camera. So I will build the spectrometer around the S95 to ensure the best spectral resolution in the visible range, but maybe have a modified Canon A810 handy in case infrared peaks are needed to identify something. I think it should be possible to make these two cameras interchangeable in the new spectrometer.
8 Comments
Fantastic writeup.
Reply to this comment...
Log in to comment
Hi Chris,
Great write up. So the impacts of narrowing the slit would be better resolution, but less light reaching the sensor - lower sensitivity. How can we correct this in spectralworkbench so that your spectra are comparable to others? It's the same problem as concentration of a solute, no? We need a way to adjust for modifications to the tool. Assuming the calibrations are correct, a peak would be in the correct spot, but not have a comparable height/
It would just be an adjustment to the formula used in the code for the intensity of light at each wavelength, right? Is the current formula viewable on GitHub?
Is this a question? Click here to post it to the Questions page.
Reply to this comment...
Log in to comment
Adam, That's right, a narrower entrance slit allows emission or absorption lines to be resolved better. So you can know more precisely the wavelength of that line, and so you can distinguish two lines that are close together. And yes, a narrower slit also allows less light to enter so the spectrum is dimmer. But generally all of the spectral lines will be dimmed by the same amount, so the relationship among line intensities (peak heights) within a spectrum doesn't necessarily change.
The absolute intensities of the peaks will change, but controlling that is devilish. Its very hard even to control the amount of light radiating from the source (e.g., a CFL bulb has to warm up, be a certain distance from the spectrometer, and be aligned perfectly with the slit and grating). With cameras that have automatic exposure control, making two spectra minutes apart that have identical peak heights is a challenge. So calibrating the PLOTS spectrometer for intensity (peak height) is an advanced topic and requires a solid laboratory bench setup. I am not sure why you would want to be able to compare intensities among multiple spectrometers.
In many cases, the location of the emission or absorption line is the key data, how intense the line is might be less important. In some cases the relative change in intensity (e.g., due to absorption of light by a sample) will be adequate, so absolute intensity calibration is not needed.
A problem with a narrower slit is that the camera won't record anything if the light is too dim. But in some lab situations when capturing still images, you can make as long an exposure as needed and record a good spectrum with an extremely narrow slit. That requires a camera with complete manual control.
It is not a problem that some spectrometers have narrower slits than others. Some spectrometers will produce higher resolution data than others, so one spectrometer will be able to resolve two nearby peaks that another spectrometer records as one peak. As you point out, the absolute intensities (peak heights) of these two spectrometers will not be comparable without some additional control, but I am not sure what application requires calibrating multiple spectrometers for intensity.
If you have two spectra of the same light source that you want to compare, and one is dim (low peaks) and the other bright (tall peaks), you can always export the data from Spectral Workbench into Excel and find a function that increases the dim peaks so they match the bright ones. Or add code to the Spectral Workbench sets viewer that allows applying a function to each spectrum. I am not sure what application would require that.
Reply to this comment...
Log in to comment
I was thinking that in order for users to identify an unknown substance, it would be necessary for differing intensities to be compared across spectrometers. I guess we could use a mathematical work around though. The mathematical relationship between peaks will be the same for each substance. I guess in our reference database that we hope to build, we also need to calculate the intensity of each peak at each wavelength. If we have data for what the peak heights are relative to each other, then we can ID substances.
Reply to this comment...
Log in to comment
Adam, You must be right that some protocols for identifying substances require knowledge of the absolute intensity of spectral peaks. I am not familiar with most of the ways a spectrometer can be used, so I don't know how absolute intensity can be useful. One standard protocol is to determine if a substance is emitting or absorbing a particular wavelength. The absolute intensity of the emission or absorption can help pin down the identification, but is often not required. For example, this spectrum of a red discharge tube that was made with a PLOTS spectrometer is overlain on the standard emission lines of neon. There is no information about the relative or absolute intensity of the standard neon lines (so they are spectral lines, not peaks). Nonetheless, the spectrograph is a very good fit. The peaks of the spectrograph align fairly well with the standard neon lines, so this spectrograph can be assigned with some confidence to neon. No need for any intensity information (relative or absolute), much less calibration. Maybe someone can describe a protocol that requires intensity information.
Reply to this comment...
Log in to comment
I've been thinking along similar lines to Chris, and would also be very interested to learn more about how the kind of intensity-less matching he demonstrates compares to a methodology that accounts for absolute intensity.
I think this is something discussed on the list a lot without reaching a resolution, and the neon example is a good place to start!
Reply to this comment...
Log in to comment
https://spectralworkbench.org/sets/show/103
Is this an intensity experiment? Maybe dilution or shutter speed?
Is this a question? Click here to post it to the Questions page.
Reply to this comment...
Log in to comment
Login to comment.