NOTE: This report is truncated as compared to other annual Software Contributors Surveys due to reductions in capacity from COVID19.
Public Lab received support from the United Nations Foundation DIAL Open Source Center for 5 students to work on Public Lab software projects via Google's Summer of Code program -- 2020 is our seventh great year of open source coding with GSoC. Also thanks to DIAL, we're again part of Outreachy -- which recruits and pays software contributors to work on open source projects. These programs are a key way that we are able to develop our collaborative platform at PublicLab.org, as well as other Public Lab coding projects such as MapKnitter and Image Sequencer.
As part of our diversity and inclusion work, we especially welcome contributions from people from groups underrepresented in free and open source software, and our code outreach programs and strategies (documented at https://publiclab.org/software-outreach) have helped to dramatically expand our code contributor community in size, diversity, and productivity; we have grown 60% in the last year, building upon 2019's record-setting 400% growth, to approximately 738 contributors over the total lifetime of the project.
A partial snapshot of who we are: Our 2020 community survey shows that more than half, or >50% of respondents identify as female or non-binary, which is a huge improvement over our record-setting year in 2019 of 33% which already an order of magnitude larger than is reported in Open Source globally. See OpenSourceSurvey.org's report that only 4% of the broader open source community are identifying so. 22% of respondents identify as white or multi-ethnic and white, meaning those who have responded from Code Contributor Community are >76% People of Color. (2% chose not to respond to this question).
Our participation in GSoC, Google Code-In, and Outreachy and in initiatives such as the First-Timers-Only movement have made this all possible, and we are especially grateful to UN Foundation DIAL OSC for supporting our Code Community. This support has also enabled us to collect and promote our successful outreach and inclusion strategies through our software outreach blog and our welcome page platform, Community Toolbox (source code). For 55% of this year's respondents, Public Lab was their first experience contributing to open source code. This is roughly equivalent to last year's 57%, meaning we are continuing to attract first time contributors at about the same rate over years. Welcome!
Quick links
- The 2020 survey questions in an non-functional template form (we can make you a copy of this form if you like)
- Prior discussion on survey design
About the survey
The open period for the 2020 Software Contributors Survey spanned from January 31 to April 27, a three month time period designed to capture several waves of activity such as Google Code-In and the Outreachy Application Period. This community segment of Public Lab uses chat channels (Gitter and IRC) to communicate and platforms (Github) to coordinate work. The survey was distributed to the community via a Github issue providing context and a link to the Google Form survey. During the survey period, the issue was pinned to the top of the plots2 repository, weekly reminders were sent via the Weekly Community Check-in (another Github issue), occasional all group encouragements to respond were sent to the chatroom, and there was targeted outreach to individuals by mentioning their names in the comments of the survey's github issue. In this time period, 43 individuals responded out of a possible ~500 contributors, a 8.6% response rate. This is down from last year's 12.6% response rate.
The survey was derived from the All Community Survey designed by the University of California Davis for Public Lab, adjusted for the segment of the Public Lab community active in software contribution, while remaining aligned to the overall Public Lab Logic Model. Questions generally fall into the following three categories: demographics (age, gender, race and ethnicity, geography), participation (discovery, type, frequency, motivation), and satisfaction with the community and with community building approaches like the first-timers-only ladder. The survey was anonymous. Raw data is shared here in aggregate visualizations, EXCEPT for any long-text responses and contact info, because they could be personally identifiable.
Data: Demographic
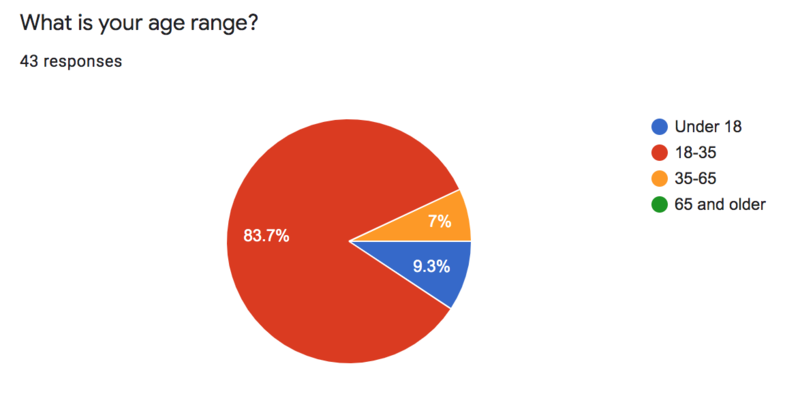
What is your age range?
Approximately 84% of this community segment is between 18 and 35 years of age. >9% are under 18 which has relevance to Public Lab's educational initiatives. 7% of respondents were over the age of 35.

How do you identify your gender?
More than half, or >50%, of respondents identify as female or non-binary or gender-nonconforming, which is a huge improvement over our last record of 33% set in 2019. Our benchmark is the 2017 global Open Source Survey which cites only 4% identifying so.

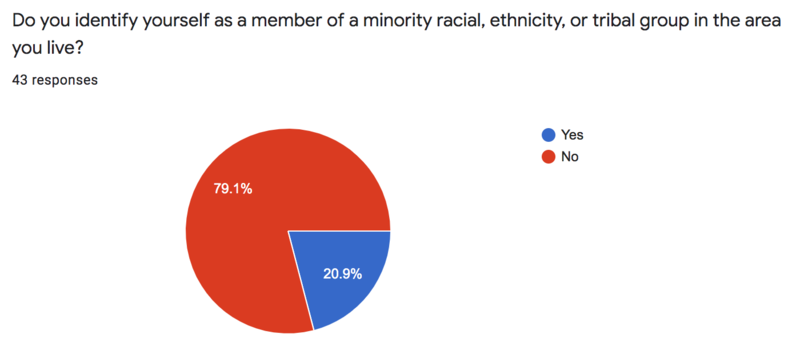
Do you identify yourself as a member of a minority racial ethnicity, or tribal group in the area you live?
This was a binary, yes/no question:
- 21% of respondents identify themselves as a member of a minority racial ethnicity or tribal group in the area they live.
- 79% did not identify themselves in this way.

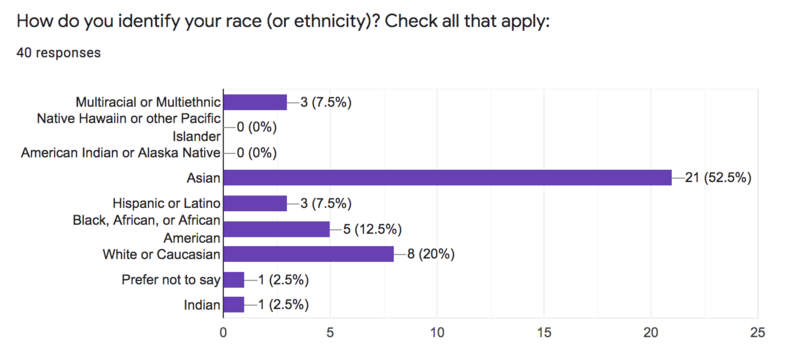
How do you identify your race (or ethnicity)? Check all that apply:
We put a lot of effort into crafting the categories for this question, becoming active in online forums dedicated to diversity and inclusion (D&I) such as Mozilla and drnikki. "Multiracial or multi-ethnic" was provided as one of the category options, and the question itself was phrased "check all that apply." Based on learnings from last year that the category "Asian" was not sufficiently detailed, this year we added category "Indian." In subsequent years we are planning to add Arab and change the spelling of Latino to Latinx.
Greater than 76% of Public Lab's Code Community Survey respondents identify as non-white, including Asian, Indian, Hispanic or Latino, and Black, African, or African American. 16% of respondents identify as solely White. 2% chose not to respond to this question. As there is little comparable data from FOSS communities (read on to find how you can help!), we looked to published statistics from the staff of large tech corporations: Google’s 2019 US workforce identifies as 46.9 percent non-white. Facebook's US workforce identifies as 55 - 56% non-white. Github's own statistics report that 80% of contributors on Github are from outside of the US with China and India being 2nd and 3rd biggest source of contributors after the United States (see https://octoverse.github.com).

3 Comments
This is really insightful, thanks @liz
Reply to this comment...
Log in to comment
Hi Liz, thanks so much for compiling this, it's very interesting to look at it next to the 2019 report: https://publiclab.org/notes/liz/04-15-2019/report-2019-software-contributors-survey
I appreciate the different display types (esp the move away from pie charts).
One small but important thing is that I noticed it seems you are not counting multiracial/multi-ethnic as identifying as people of color, perhaps if they also identify as white, although it's not clear exactly how you're parsing that:
I do want to point out that many people who consider themselves multiracial/multi-ethnic and also check a box for "white" may identify as people of color (like myself), so I'm curious to know if that may be better shared as a distinct group or as part of POC; and in general perhaps it would be better to specifically ask if respondents identify as POC.
Thanks!
Thank you for the close read! The re-phrased sentences now read:
Reply to this comment...
Log in to comment
Login to comment.