About Me
Name: Rishabh Rawat
Github: https://github.com/rishabh570
LinkedIn: https://www.linkedin.com/in/rishabh570
Email: icode365@gmail.com
Location: New Delhi, India
Affiliation: Maharaja Surajmal Institute of Technology, GGSIPU
Degree: Bachelor of Technology in Electronics and Communication Engineering
Project Description
Leaflet environmental layers is a plugin that offers different environmental maps for people to use. It has different overlays that are made possible by pulling the data from various sources. It is in a healthy state right now but there are definitely some places for improvements. Time slider UI is one of those improvements that could use some help and it can enhance the user experience of LEL to a great extent.
Abstract/Summary
The project aims to add support for the time slider UI in the LEL (Leaflet Environmental Layers) project along with some bug fixes and creating FTOs (first-timers-only) along the way while ensuring the stability (by tests).
Implementation
Adding Time Slider UI
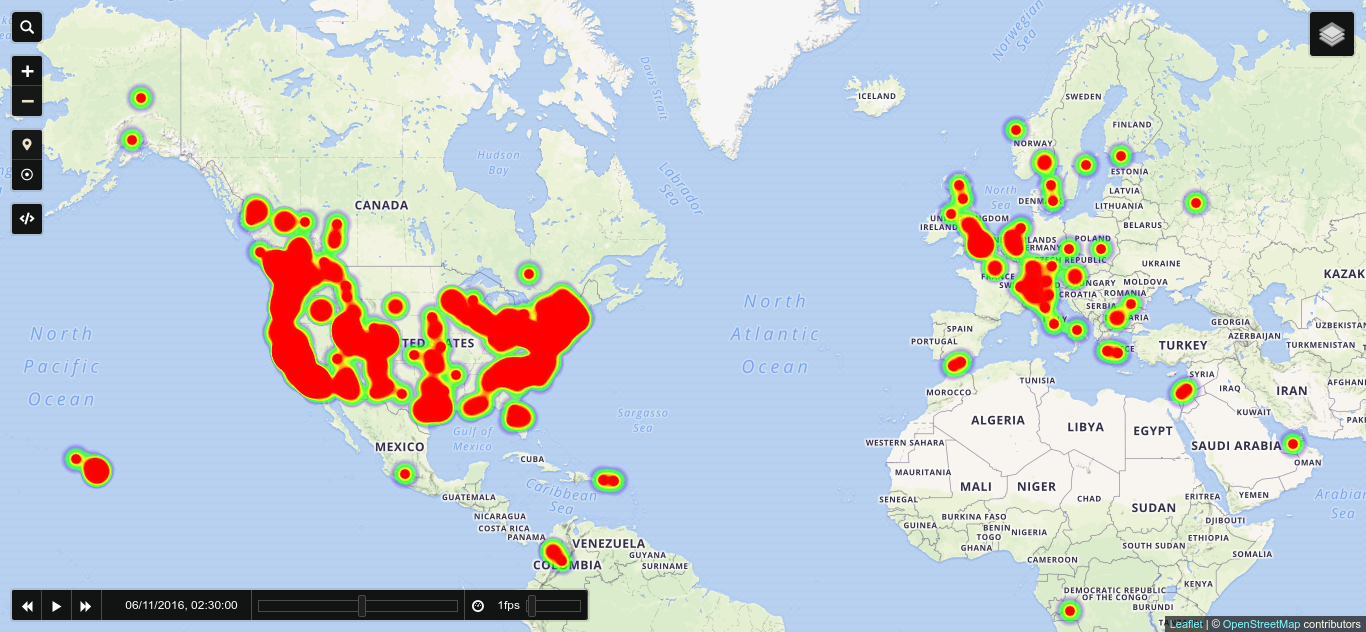
To make things clear here's a demo GIF that shows how time slider works on a leaflet map,

The process of enabling this functionality includes the following steps:
- Include the time dimension related options to the map options. This is done at the time of map creation. Here in our case, this could look like:

- Convert the layers to the time dimension layers.


- Pass these time dimension layers to the "overlayMaps" that we use for the leaflet control layer.
So as we have many layers and "Time Dimension" plugin only works for the WMS and geoJson layers, we need to create classes that extend "L.TimeDimension.Layer" for converting non-WMS layers into time dimension ones. (I asked this here) As a part of understanding the project, I tried to work on the "Purple layer" and converted that to a time dimension layer so that we can see the heatmap overlay according to the time shown on the time slider. The time that we select through the time slider is the time that we use to compare against the creation time for the heatmap data. Here's a little glimpse of what I achieved,

(The reason for the map not getting updating after first-time slider shifting is the request being blocked by CORS policy. I see this issue regarding this, so I guess this is another thing that we can focus on next.)
Here are the steps that I took to achieve this,
- Modified the map options to include time dimension options.

- Added the time dimension layer for the purple layerGroup.
L.TimeDimension.Layer.PurpleTimeLayer = L.TimeDimension.Layer.extend({CODE});

L.timeDimension.layer.purpleTimeLayer = function(layer, options) {
    return new L.TimeDimension.Layer.PurpleTimeLayer(layer, options);
};
where CODE includes "initialize", "onAdd", "onNewTimeLoading", "isReady", "getDataForTime", and "_update" functions.
Here are the snippets of the functions,
initialize function
initialize: function(layer) {
    let timeLayer = new HeatmapOverlay(layer.options);
    L.TimeDimension.Layer.prototype.initialize.call(this, timeLayer, layer.options);
    this._currentLayer = timeLayer;
    this._currentLoadedTime = 0;
    this._currentTimeData = {
        max: this.options.heatmapMax || 10,
        data: []
    };
    this._baseURL = layer.options.PurpleLayerURL || null;
},
onAdd function
onAdd: function(map) {
    L.TimeDimension.Layer.prototype.onAdd.call(this, map);
    this._map = map;
    if (this._timeDimension) {
        const timeParam = this._timeDimension.getCurrentTime();
        this._getDataForTime(timeParam);
   }
},
_onNewTimeLoading function
_onNewTimeLoading: function(ev) {
    this._getDataForTime(ev.time);
    return;
},
isReady function
isReady: function(time) {
     return (this._currentLoadedTime == time);
},
_getDataForTime function
_getDataForTime: function(time) {
    if (!this._baseURL || !this._map) {
      return;
    }
    let url = this._baseURL;
    $.get(url, data => {
        data = data.results;
        delete this._currentTimeData.data;
        this._currentTimeData.data = [];
        for (let i = 0; i < data.length; i++) {
            if(data[i]['Created'] >= time/1000) continue;
            let marker = data[i];
            if(marker && marker.Lat && marker.Lon && marker.PM2_5Value) {
                this._currentTimeData.data.push({
                    lat: marker.Lat,
                    lng: marker.Lon,
                    value: marker.PM2_5Value,
                });
           }
      }
      this._currentLoadedTime = time;
      if (this._timeDimension) {
           this._update();
      }
    });
},
_update function
_update: function() {
    this._currentLayer.setData({data: this._currentTimeData.data});
    this._map.addLayer(this._currentLayer);
  }
- Finally, wrapped the "PurpleLayer" with the "PurpleTimeLayer" and used the latter in "overlayMaps".
let purpleTimeLayer = L.timeDimension.layer.purpleTimeLayer(PurpleLayer);
By approaching a similar approach we can convert all the layers to the time dimension ones. There is a lot of scope for improvements here and it is open for discussion. Currently, we have all the layers in the "src/" folder, so we can either have the time dimension layers in a separate folder (like "src/timeLayers/") or we can try to incorporate that into the existing layers.
Fix other open issues
Once I finish working on the time slider UI, I would try to solve as many open issues as possible and create FTOs along the way. As I've just started working on the project, I didn't have much time to work on other features & bug fixes other than the time slider one. But there are many open issues that can be worked upon, so I'm positive about that.
Timeline/Milestones

Needs
I'll be needing the guidance of my mentor(s) and the community.
Contributions
Pull Requests
Issues
Experience
I am currently in my final year of Engineering and I've been contributing to PublicLab since Oct 2018. I've worked on various personal projects & currently working on a node.js command line utility which show the live cricket match stats on the terminal (https://github.com/rishabh570/cricfeed). During my summer internship at Malik Ventures I have worked on two of their projects (harvin.academy and radixhealthcare.org) which required the knowledge of node.js/express framework, mongoDB database. I have also worked with coding blocks as a part of their annual summer of code event named Bountiful Open Source Summer (BOSS) and ranked in top 10 winners. Some of my other personal projects include Django based website named refresher (https://github.com/rishabh570/refresher), python based CLI app that tells about famous landmarks near you (https://github.com/rishabh570/aroundme) and a firefox add-on for dynamic themes (https://github.com/rishabh570/themed).
Teamwork
I have participated in various team hackathons and events. As a part of my summer internship with Malik Ventures, I've worked with a team of 6 engineers on two fullstack projects (harvin.academy) and (radixhealthcare.org). I've also worked with PublicLab as a student developer during Google Summer of Code 2019 and mentored students during Google Code-In 2018.
Passion
Working with PublicLab helped me learn & implement things which really impacts people and the trust and support from mentors helps in moving forward with the project. With this project, I would love to add the time slider functionality along with bug fixes to the leaflet environmental layers project.
Audience
This project would help in adding the time dimension to the leaflet environmental layers so that users would able to see the data according to the time shown in the time slider.
Commitment
Yes, I understand that it is a big commitment and I will be fully commited to the project.
3 Comments
@warren @bansal_sidharth2996 Please take a look. This is my proposal for leaflet environmental layers. Any suggestions are welcome! 😃
Thanks!!!
Thanks for your proposal! This looks really good. Curious if you're familiar with the NPM publishing process, and how these various libraries fit together for display on PublicLab.org? Thank you!
Is this a question? Click here to post it to the Questions page.
Hi @warren, thanks for your feedback! So, as far as I know for an already established npm package like LEL, we need to bump up the version number (according to the patch, minor & major changes that the project goes through) and do "npm publish" each time we need to push updates to production. This doesn't include the steps that we take during the development (like transpiling, testing, building etc.). Actually, there's a personal project of mine which is in the development phase and I'm going to push it to npm soon (you can see it here: https://github.com/Rishabh570/cricfeed), so I'll make sure to fill the knowledge gaps that I may have currently.
Actually, I've never worked on plots2 but I've noticed that we use LEL there and the relevant code is present in "/app/views/map" where "mapDependencies.html.erb" uses the CSS & JS file that we build in LEL project (present in '/dist') which is included in the "/app/views/layouts/header.html.erb" and that helps in importing the LEL files to the map in plots2. It is live at https://publiclab.org/map I reckon. Please let me know if this is not how LEL works in plots2.
Thanks!!! 😃
Reply to this comment...
Log in to comment
Login to comment.