
Link to google docs- https://docs.google.com/document/d/1B6qKtyseTW8RWQx9-1KifwnR-aGxW8XSfXAENOp7Jtc/edit?usp=sharing
(I would recommend going through the link provided above as many of the things appear broken below and request reviewers to drop comments at the comments section of this proposal
About me
Name: Vanshika Gupta
Email: vanshika421@gmail.com
Github: vansjyo
Affiliation: Third year Undergrad at NITK, Surathkal
Location: India (GMT+5:30)
A Web Enthusiast, with an aim to add value to the way people live their lives by implementing what I have learned so far. I aspire to do research in computational sciences and mathematics and am always open to new Technology and topics.
Project description
Revamp the website interface and adding User friendly features
Abstract/summary (<20 words):
Provide an appealing user interface and adding more involved features to ease browsing.
Problem
Currently, the website has a lot of scope, pages and activities that a visitor can perform and browse through.
The advantages of the current website:
- The aim of knowledge exchange platform of public labs.
- The community toolbox and various other great features.
- A lot of good work and useful features are visible in the current website.
The problems to be addressed are as follows:
- For a first timer, the website is not friendly and appealing.
- The website https://publiclabs.org does not have a proper and meticulous arrangement of data and useful links which confuses the user and makes it hard to figure out the flow of navigation.
- There are many back-end and front-end bug fixes which need to be addressed.
- Since the website contains data from both crowdsourcing as well as the community members, a proper segregation is necessary.
Proposed Solution
Redesigning and enhancing the User Interface of the website.
The advantages of the proposed solutions are as follows:
- Adding intuitive and user-friendly features which will increase the overall experience of the user. A proper organization of the website will also ease the navigation.
- The website has many bugs which may seem to get solved over time by opening issues. However, redesigning the whole UI will not only solve the existing bugs but also let the community members develop further on new ideas to be incorporated in the organization and identify the places where there is a scope of improvement in terms of utility and functionality.
- Redesigning the UI will subsequently have a major impact on the overall experience of the website.
The disadvantages of the current implementation :
- Requires time and regular feedback from community members to build an organization for all.
Timeline / Milestones
Milestone 1: Modifying the People Page
Current Idea
- Changing the rows displayed to responsive and appealing cards with data organized meticulously. Figure 1 shows card prototype. The responsive display shown in Figure 2 and 3 will be common to all the pages.
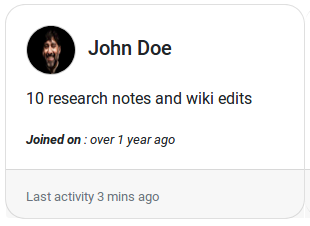
Figure 1: Card Prototype
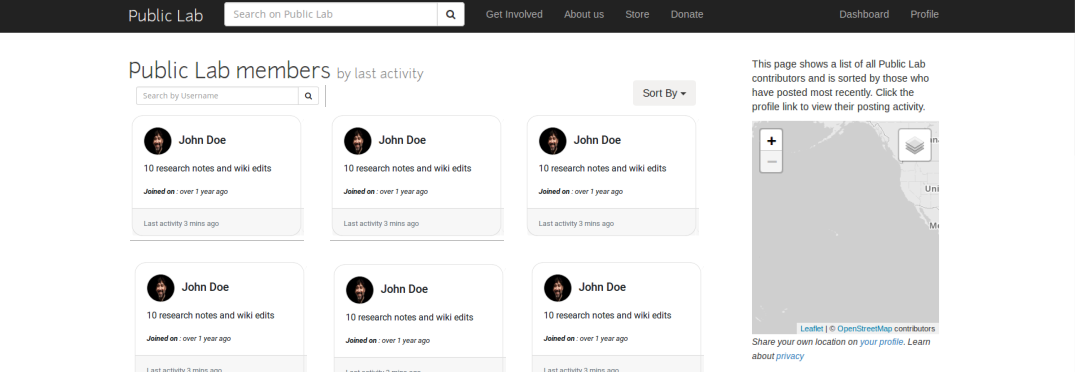
Figure 2: Card Layout
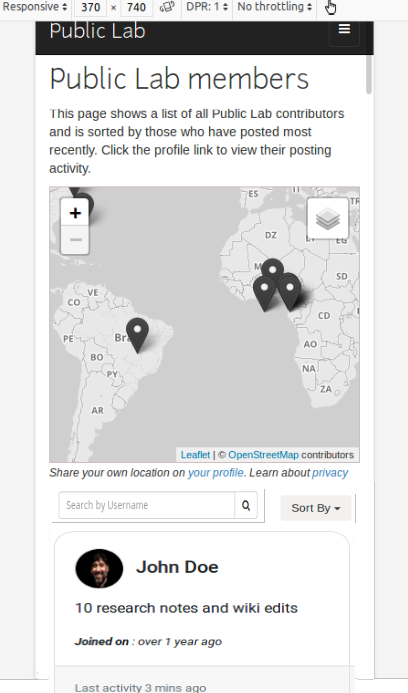
Figure 3: Mobile view of Card Layout
- Modify the overall layout of the page to display the map on the right side to make optimum use of space as shown in Figure 2.
- Add search bar to search people by username. Give a sort select input to sort the people by username, recent activity, followers or popularity, etc. This needs fetching various fields from the user model and sorting.
Milestone 2: Modifying the Tags and Tag Names Page
Current Idea:
- Show responsive appealing cards instead of rows. Figure 4 shows the design of a tag card with the information concise and displayed intuitively. The display will be same as the '/people' page with the statistics graph displayed to the right.
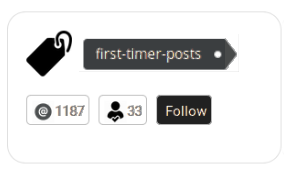
Figure 4: Tag Card
A search input and a "sort by" select input to sort the tags by the number of followers or the number of mentions will be provided similar to the "/people" page.
Add more statistics representation options(eg. Pie Chart, Bar graph). This is a very important feature for a user(or "people", as considered to be more human by the public lab community) to help explore trends in the tags. The current graphical representation is not easy to visualize and can only give information about the most used tags(since they are the only ones visible clearly).
We can give bar graph representation to show how many times a particular tag was used or an activity in a tag over a period of time monthwise. This feature can be incorporated in the "/tags/" page.
The CanvasJs API library can be used to build them which has a very compelling outlook.
Minor Bug fixes(eg. Clicking on "Show Graph" should toggle the state of display of canvas. (currently, it adds another canvas display on multiple clicks)
Modify the "/tags/tag-name" page to a similar layout and card representation.
Add relevant sorting or search options as proposed in other pages.
Modify the arrangements of the content in the card in a similar manner to that of the proposed 'question' card with a card header image.
Milestone 3: Modifying the Questions Page
Current Idea:
- Modify the card and display contents in a more organised matter.('Post an answer should be pinned to the end and tentatively add bubbles for likes and comments instead of '|' pipeline as separator) as displayed in figure 5.
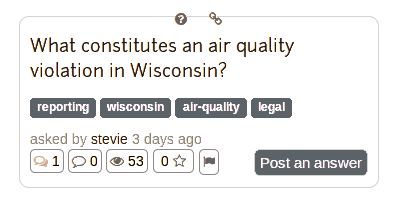
Figure 5: Question Card
"Ask a Question Here" input search box is not needed, instead we can have a button which redirects us to a form where the question has to be asked.
Allow various more filtering options for questions based on popular tags and allow search question by title, author and tags etc. The order after applying the search criterion will be "most recent + filter". The user can select only one of the options at a time. Further, the resulting filtered query can be sorted by the sort options.
A "sort by" or "choose filter" option instead of a tab(as in the current view of the website) can be provided which will open a select input is displayed and "onChange()" input will call the filter function.
A stats of the total number of questions asked by the user logged in can be displayed on the side along with the featured topics.
The responsive look will be designed. The overall layout will be as shown in figure 6.
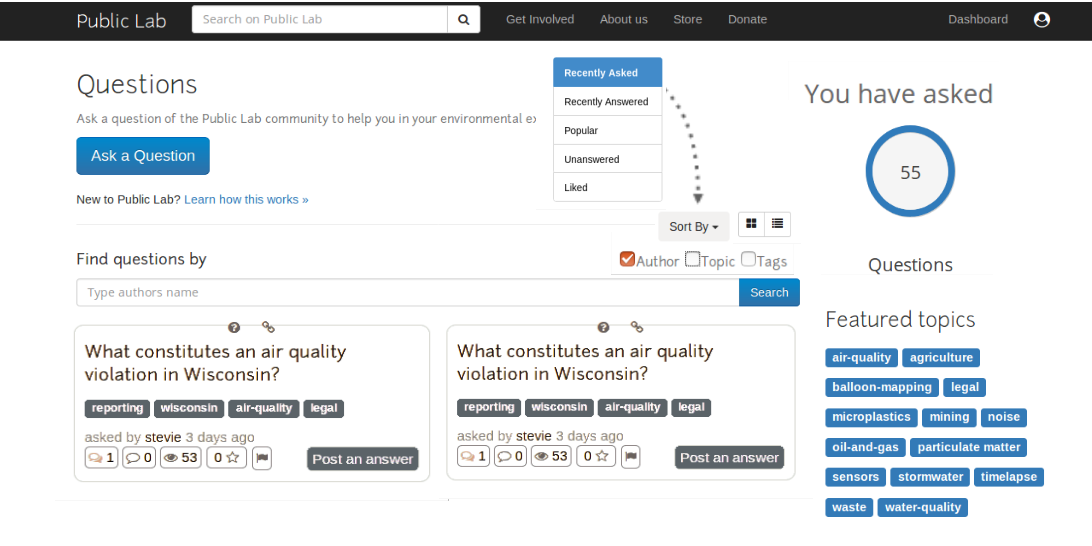
Figure 6: Questions page layout and filter/sort options
Add a row section of cards to state the scope of the website rather than placing buttons for it randomly anywhere on the screen. This is an important pointer as the current header navbar does not have options to go to these pages.
Show recent activity based on a combination of recent activity, subscribed tags and most popular. Provide a tab bar to select the type of activity to be displayed.
For activity based on particular tags, a search bar to enter the tag names can be provided and clicking on the search will filter the activity based on the chosen tags,
The design layout for the "/dashboard" is shown in Figure 7.
For the slider component, we can use flexslider or any other simple library to display it. This will contain posts from the community members specifically for giving any important updated to the user about updates for eg. links to survey, organization related activities taking place, etc).
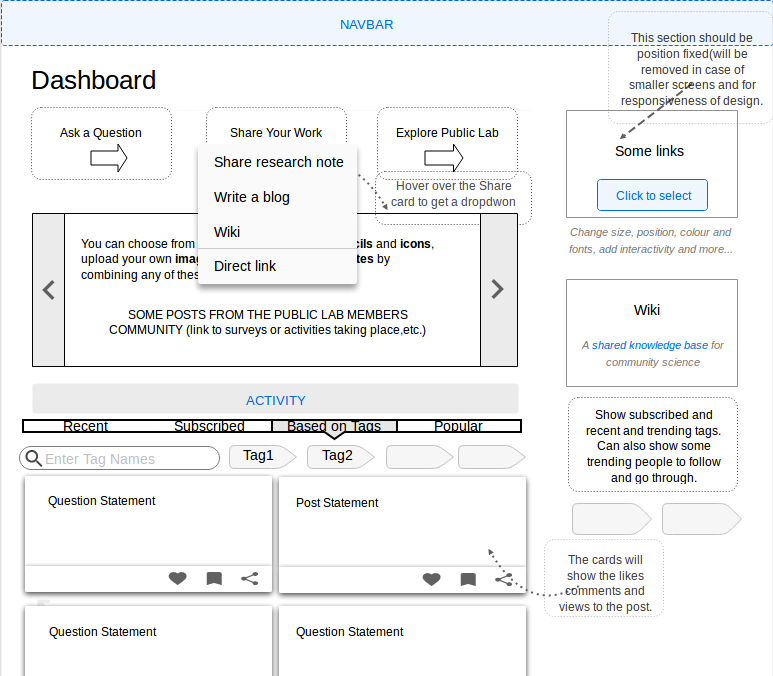
Figure 7: Dashboard prototype
Milestone 5: Modify Profiles Page
Current Idea:
- Redesigned profile page is shown in Figure 8.
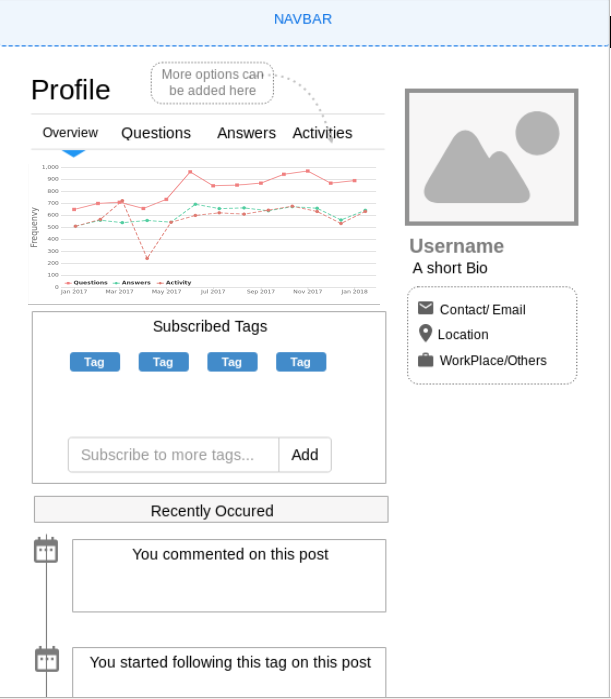
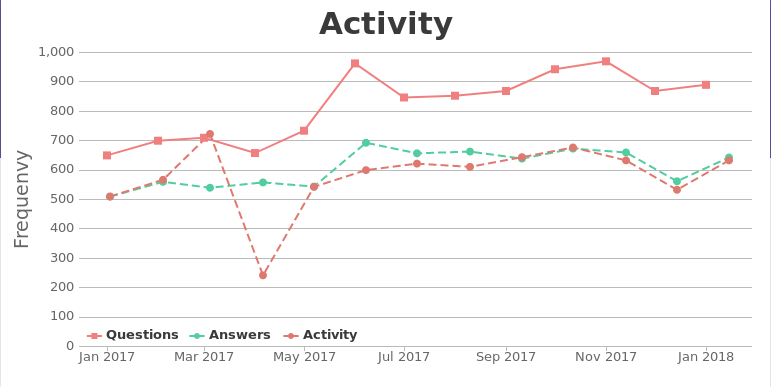
- Add a multiple line graph(using simple Canvasjs Library) as shown in figure 9 to show the activity month wise so that a reasonable frequency can be accumulated instead of showing it daywise.To do this, the log of the user can be fetched on a monthly basis and accumulated to be shown in the graph. The labels to the activity can help in segregating it into activities, questions, answers, etc, which is not a very involved task.
Figure 9: Activity Graph
At the bottom, the recent total activity of the user can be displayed with a vertical responsive timeline which is easy to make
Under the respective tabs, for eg Questions tab. All the questions asked by the user will be displayed and the graph will be removed, recent activity and subscribed tags will be moved below the questions or can even be removed. However, the right side profile section containing the photo and bio will remain fixed.
In the overview, we will add a section for only subscribed tags as the profile page has to only show information specific to the user.
The subscribed tags will be displayed right below the activity graph and an option to add more will be provided.
Milestone 6: Adding common featuresCommon additives to all pages.
Adding a proper introductory text to enlist the scope of the page, below the heading of the page.
Add option of filters rather than tabs for sorting. Give the option of adding multiple filters wherever possible.(eg. In "Questions" Page, filter "Unanswered" + "Popular" Questions.). This will help find things of their interest easily.
This will involve double sorting
- Adding a customized loader to the website. (Like this). The below link is a tutorial to how to create your own personalized custom loader. This is important as the pages take a lot of time in loading. We can make a loader that is themed to the public lab organization. https://www.toptal.com/designers/product-design/how-to-create-custom-loading-animations-to-decrease-bounce-rates
For this, we will have to render the loader in the view when the data is being fetched or while the component is being rendered. A flag is_loading can be used as follows

- Change the title according to route. (eg. The title of the web page of the route /people should be "People | Public Lab" instead of "Public Lab | People" to ease navigation for a user with several public lab tabs opened).
This is an important entity missing in the website as all existing websites use the title of the page first followed by the website name.
Enhance footer with interactive Bootstrap Icons for links to Github and more, and decrease the text. Balance font weights.
Position of "Scroll to Top" button should be fixed to the bottom right corner of the screen when the user scrolls a span of 1 'window.innerheight' and not be attached to the footer. A nice animation can also be added to the utility for smoother transition.
Some minor bugs (for eg. In case of smaller screen view, Clicking on anywhere on the web page should close the menu opened using navbar icon.) can be addressed subsequently as the project proceeds.
Milestone 7: Optional or Extended
If there is still time left, or probably as I dig deeper into the code, side by side, I would also want to take up the task of speeding up the website. The website is quite slow even with a fast internet speed.
There are various ways in which the website loading speed can be enhanced. For example, using base64 images wherever possible. This is a wide topic to state explicitly and has no set boundary conditions. I have researched some ways regarding this and would be thrilled to know more. But for the time, we can set this as optional depending on the suggestions from the mentors.
This is an important part of a website as we all can comprehend. A slow website is bad not only for the end-user, but also for search engine optimization (SEO) causing your website to rank lower in search engine results.
Timeline


Needs
What resources I will need: people to guide me, documentation for new features mostly available online.
First-time contribution
I have recently started working on some of the issues.
Merged:
- Make questions bar graph responsive
https://github.com/publiclab/plots2/pull/5043
Open:
- Fix "Show 0 more" on inline people lists
https://github.com/publiclab/plots2/pull/5107
Issues:
- Clicking on Publish Note shows buffering icon
https://github.com/publiclab/plots2/issues/5103
Experience
I started coding in C as a course in the first semester of college. Before that, I had little knowledge of basic HTML and VBScript. I first got my hands on development in the first year at college when I proposed to create a fully fledged E-commerce website(with admin, staff, user interface) for my college supermarket as a part of an IEEE project(GitHub link).
Further, I worked on developing Oauth Applications, Disaster Management Web app, etc which are mostly available at my GitHub profile. I have also interned at a startup called Carabiner Tech. as a Software Development Intern for about a month where I added some features to the OCLAVI API(unlocking feature, adding image editing options). I have worked using Angular, React and Django and have a good understanding of frameworks. I am currently working on learning Python and Ruby. Some mentionable projects I have done in a team are described in the next section.
Some notable projects that I did which I would like to mention:
- E-commerce website: This project was made by me from scratch without the use of any existing templates or work from existing repo. Build using ExpressJS, Node.js, it has nearly all the features of a fully fledged E-commerce. A detailed Readme.md is available here.
- Dimensionality Reduction of Hyperspectral Images using spectral Clustering: This is a preprocessing step for such images which have several hundred bands as performing any processing on such images requires a lot of storage and is computationally heavy. Using spectral clustering, the optimum number of bands is chosen using various algorithms implemented using MATLAB. My research paper on the same was also accepted in the CCIS Springer publication (to be published by May end),.
Apart from my contributions to the publicLab.org Plots2, I have made contributions to the following Open Source Projects
- Mozilla Firefox-DevTools Profiler Codebase - Web app for Firefox performance analysis
- TaskCluster-Taskcluster is the task execution framework that supports Mozilla's continuous integration and release processes.
Teamwork
I have been a part of several projects in college some of which are available are available
- INCIDENT 19- My responsibilities included Design of timeline module for the website and testing. I worked with a team of 10 people.
- WebClub- I am an executive member at the Web Enthusiasts' Club NITK and a contributor to the website.
- Disaster Management Web app- Made this as a part of Microsoft codefundo++ in a team of 2. It helps anyone to report missing/found people in the face of a disaster. It makes use of ThingSpeak API by MathWorks to retrieve data from channels receiving data from IoT devices and sends a notification to the user or website when a certain parameter(eg. rainfall) exceeds a certain permissible value.
- Winner of 24 hrs Women's Hackathon conducted at our college by IEEE NITK, where our team built a depression chatbot using Google API Dialogflow
- Open Source Virtual Instrumentation - Remote Testing of devices (eg. LED) using web app and RPi. In a team of four people, My responsibility was to design the UI and port the flask app to Django. I also learned about the basics of RPi.
Passion
The vision of Public Labs is in itself an inspiration for many. Reliable and sufficient information is essential to study the aftermath of an event and extract information from data. It also helps in investigating the possibility of an event in the future which can create a significant impact on humanity. I aspire to be a part of such an organization and bring a difference in the lives of people, however minimal. I have a strong inclination towards Development and Mathematics, and if this endeavor can be utilized to make such an organization better, I would be obliged to be a part of it.
Audience
The target audience is the "People" who are directly or indirectly a part of this organization or looking forward to being a part of this organization as the project implementation will make their experience exploring public labs better and more intuitive.
Commitment
I understand my commitment to the projects and the organization and I will dedicate the best I can to make the most of this opportunity. I can devote upto 30 - 40 hours a week during the duration of the internship.
5 Comments
Hi Everyone, This is my outreachy proposal. There are some formatting glitches in this. Hence I would highly recommend everyone to go through the google docs link shared at the start of the proposal. However, comments can be dropped here itself. @cess @gauravano @warren @bansal_sidharth2996 and others please have a look.
Reply to this comment...
Log in to comment
Nice proposal Vanshika and great designs 🎉 !
Reply to this comment...
Log in to comment
Actually, I noticed that you haven't mentioned any FTO issues creation in your proposal. I would like to mention that during the duration of your project we would really appreciate if you create 1 or 2 FTOs every week or two just to welcome new contributors to your project and Public Lab.
Thanks!
Sure @gauravano. I have indeed mentioned it only once in the proposal. I'll add that as a task at the end of each week. Thanks a lot.
Reply to this comment...
Log in to comment
Hey @vanshika421 this looks really interesting!
Quoting myself from @gautami_gg's proposal,
I really liked on how you tackled the issues with such detail and visualized a bit with the back-end too!
Thank you for sharing your proposal with us! Nice work!
Is this a question? Click here to post it to the Questions page.
Reply to this comment...
Log in to comment
Login to comment.