Abstract: The note describes eight colormaps available in Public Lab’s Image Sequencer online analysis tool. Colormap applications, Image Sequencer processing steps and a NDVI colormap comparison are discussed and demonstrated.
Introduction:
- Image sequencer is an online tool for image processing and is available at http://sequencer.publiclab.org/examples/#steps=
- Colormaps (re)color or transform an image to help visualize different aspects of the scene. The colormaps discussed in this note are designed primarily to assist in analyzing Normalized Difference Vegetation Index (NDVI) images but they can also be used for other types of applications.
- This note concentrates on Image Sequencer colormaps but there have also been many other updates since the tool was introduced in 2017. More information on Image sequencer is available at: https://github.com/publiclab/image-sequencer
NDVI colormaps can be used to calibrate NDVI scenes or help separate one crop from another. All of the Image Sequencer NDVI colormaps scale reflective light from the plant from a -1 (left) to +1 (right) value. Information on how to apply NDVI and colormaps is available at: https://publiclab.org/wiki/ndvi and https://publiclab.org/notes/cfastie/08-26-2014/new-ndvi-colormap.
Note that http://infragram.org/sandbox/ also provides colormaps but does not contain many of the advanced features available with Image Sequencer.
Image Sequencer Colormaps
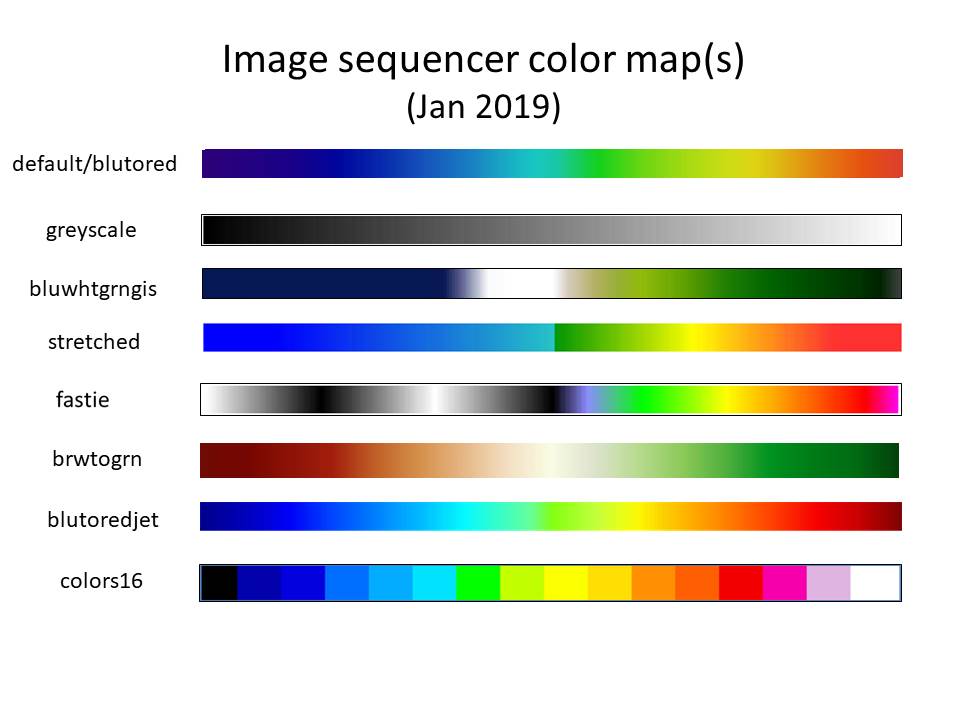
The picture below depicts the Image Sequencer colormaps. The names associated with the colormaps describe the major color pattern or origin.

NDVI Colormap applications
Selecting a NDVI colormap for a given application depends on the situation. The default (blutotred) setting is often used since it permits comparison with NDVI images available on Public Lab. Other colormaps may be useful for calibration, monitoring plant health or distinguishing different crops. The chart below lists colormaps with their typical application.

Image Sequencer Colormap Example
The rest of this note describes how colormaps can be used with Image Sequencer to process NDVI measurments. The picture below shows how Image Sequencer commands can be used to display colormaps. (This is a brief introduction to Image Sequencer if you’re not familiar with how to input sequence commands.)
- Load image sequencer at: http://sequencer.publiclab.org/examples/#steps=
- Find ‘Select a new module to add to your sequence’ and click on the ‘more modules’. Select ‘Gradient’ from the drop down menu. This will create a gradient image that is black on the left side and transitions to white on the right side. Select ‘Add step’ to enter the sequence step.
- Select the next step by selecting ‘colormap’ form the drop down menu. Select ‘Add step’ to enter the sequence step.
- The ‘default’ colormap should now be visible. Select other colormaps by ‘Name of the Colormap’ menu and pressing the ‘Apply’ box.

NDVI Reference Data
Now that we know how to enter processing steps into Image Sequencer, the next thing we need is some NDVI data to analyze. This note uses imagery observations from the Ikonos satellite over Idaho as a NDVI reference image: https://wiki.landscapetoolbox.org/doku.php/remote_sensing_methods:normalized_difference_vegetation_index The Ikonos Idaho image was selected because the reference provides true color, near infrared (NIR), ‘red’ band and NDVI processed imagery.

Image Sequencer NDVI
The Image Sequence processing steps used to process NDVI images are shown below. Steps include: 1) Choose file #1 (NIR image), 2)Choose file #2 (Red band image), 3)blend, 4) NDVI (red), 5) Colormap (greyscale). Comparing the Image Sequencer NDVI image against the published Ikonos Idaho NDVI image shows that the images do not have the same level of detail. Since the Ikonos Idaho NDVI images are scaled for 0 to 1 and the Image Sequencer image from -1 to 1, additional processing is needed to compare the images. An additional step (contrast enhancement) was added to the Image Sequencer NDVI images to show that both NDVI processing methods provide similar results.

Adding Colorbars to Colormaps
Before we show examples of different ‘colomaps’ it is necessary to add ‘colorbars’ to the images. Colorbars provide a reference display or key that describe how the reflection values change across the colormap. It’s good practice to always include a colorbar in every NDVI picture so others can interpret the NDVI color scale. Fortunately, Image Sequencer provides an easy way to add colorbars via the ‘colorbar’ command (see picture below). Colorbar is composed of 4 separate steps (gradient,colormap, crop, overlay) but is a single entry from the Image Sequencer drop down menu. For this research note, all colorbars have a range from -1 to 1 and are positioned on top of the NDVI image.

NDVI Colormap Comparison
In order to show how different colormaps visualize a NDVI image, Image Sequencer was used to display all eight colormaps/colorbars using the same Ikonos Idaho satellite dataset. The images (see below) were created by changing the colormap/colorbar selection while keeping the other parts of the image processing sequence the same. This ‘back and forth’ method of swapping parameters demonstrates Image Sequencer processing versatility as an image optimization tool. Factors that influence colormap selection include:
- calibration - matching known reference measurements
- subjective image appearance - making certain details ’pop’ for emphasis
- consistency - permit comparison with prior measurements or other sensor data
- display limitations – black/white display, colorblind, etc
- additional processing – measure color features by computer vision techniques

In conclusion, this research note demonstrates eight colormaps for use with the Image Sequencer online processing tool. Satellite data was used to compare how the different colormaps picture the same NDVI data collection. As discussed above, colormap choice is application dependent. Image Sequencer provides a way to quickly display and analyze the different color settings. Have fun with it!
Working notes:
Different programs were used to generate and display colorbars. Code examples are at: https://publiclab.org/notes/tech4gt/08-09-2018/gsoc-2018-work-on-image-sequencer. Image Sequencer colormap feature is at: image-sequencer/src/modules/Colormap/Colormap.js
9 Comments
@warren awards a barnstar to MaggPi for their awesome contribution!
Reply to this comment...
Log in to comment
Great to hear from you @maggpi! This is tremendous!
Reply to this comment...
Log in to comment
EDIT: Did some further testing and it was an error on my end. Used the wrong module to colormap the pictures. Ill leave the rest of the comment though for future reference.
Is the fastie colormap correctly implemented?
This is my original image taken with Raspberry PI NoIR camera with blue filter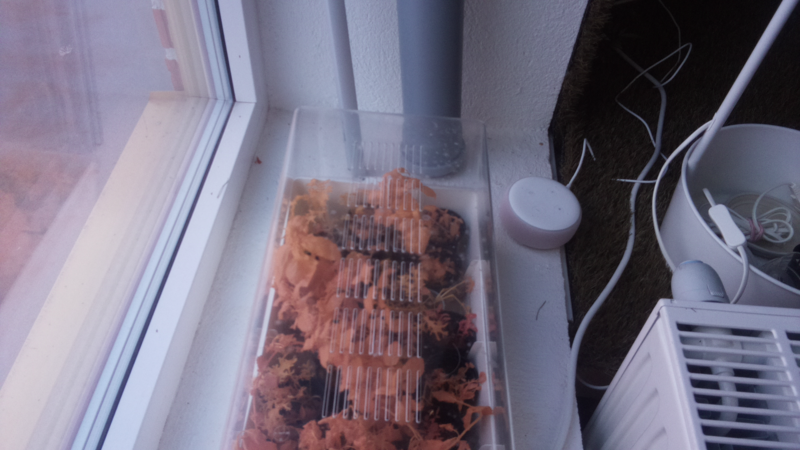
I have written my own application for processing images and applying the fastie colormap. I get these results
With the imagesequencer tool from the same original image I posted at the top I get these results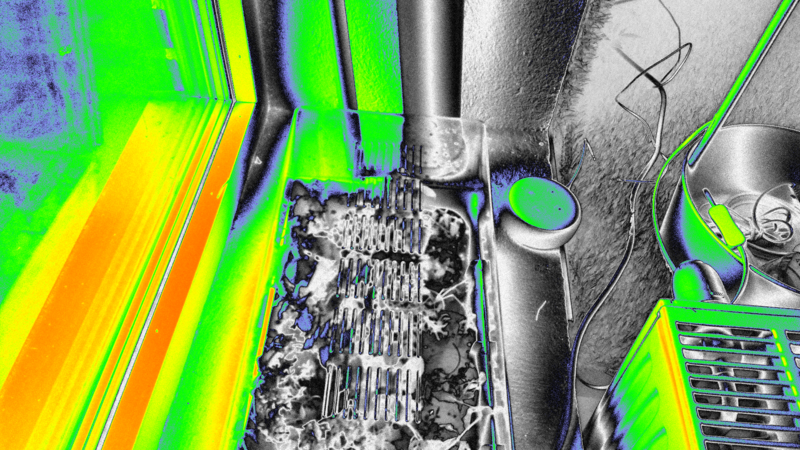
To me it seems that the values have been inverted.
Otherwise very nice tool!
Is this a question? Click here to post it to the Questions page.
Reply to this comment...
Log in to comment
Hi! Very cool! I'm curious if you've posted your code anywhere, I'd love to see it!
Reply to this comment...
Log in to comment
At the moment I have only the code on private repository. I will conduct an experiment where I try to look for changes in NDVI values corresponding to changes in the plants environment. I will post my findings to this site.
Reply to this comment...
Log in to comment
Oh that's super, we'd love to see it. Thanks!
Reply to this comment...
Log in to comment
Also, I wonder if the inverted values are due to your using a blue not red filter? I believe the ndvi equation needs to be reversed too if you do that.
Is this a question? Click here to post it to the Questions page.
Reply to this comment...
Log in to comment
I really like your proposal Few suggestions We are looking forwards for supportive folks. Make sure to do 1. at least one PR review each week and
make some FTO issues in each week to involve new contributors inside your projects. People will love to be part of big projects. It is a great feeling to help others.
Please take out a day from timeline from each month at end of each phase of SoC fellowship to write about what you learnt and did in the period. Earlier it was not compulsory. But let's make it compulsory. By this mentors will be able to access your progress. Don't forget to mention the ftos which you created during this period. Also mention the PR reviews which you did.
We are planning for video calls I'm each month during SoC program. So, it will be great to see you all.
It will be great if you can review each others proposals and give some suggestions.
These are small activities which can lead to better and supportive community at PL. All participants all programs are encourage to write these in their proposals.
Thanks and best of luck.
Reply to this comment...
Log in to comment
Hi, please submit your proposal on the GSOC official website at the earliest. Thanks
Reply to this comment...
Log in to comment
Login to comment.