Introduction:
Several digital camera applications such as spectroscopy or Normalized Difference Vegetation Index (NDVI) measurements benefit from being able to automatically detect image color patterns. This research note describes computer vision software (OpenCV/python) that can measure color characteristics of an image. Two different examples illustrate how color detection can be used. The first application is a spectrum generated by a crossed grating/white light LED. The second application uses a NDVI image obtained from https://publiclab.org/wiki/ndvi .
Computer vision color detection: Color detection using computer vision techniques is described in https://docs.opencv.org/3.0-beta/doc/py_tutorials/py_imgproc/py_colorspaces/py_colorspaces.html and in https://www.pyimagesearch.com/2014/08/04/opencv-python-color-detection/
A video walk thru is available at: https://www.youtube.com/watch?v=ggBCx4nVQ4I
Python/OpenCV software (https://opencv.org/ ) developed to implement these techniques is described below:
--1: Color input image is loaded into the program
--2a. Image is scaled and converted to Hue, Saturation, Value (HSV) colorspace. See https://en.wikipedia.org/wiki/HSL_and_HSV for more info on HSV.
--2b. Trackbars are created with lower/ upper colorspace options,
--2c. Image, image mask and trackbars are displayed.
--2d. Mask is overlayed with imaged showing color selection. User selects color range with H,S,V trackbars.
--3a. H,S,V values indicate selected color. Note OpenCV HSV colorspace range is H: 0 - 180, S: 0 - 255, V: 0 – 255.
A video demonstartion of sorting the color red is posted at: https://www.youtube.com/watch?v=ggBCx4nVQ4I
 !
!
Spectroscopy Example:
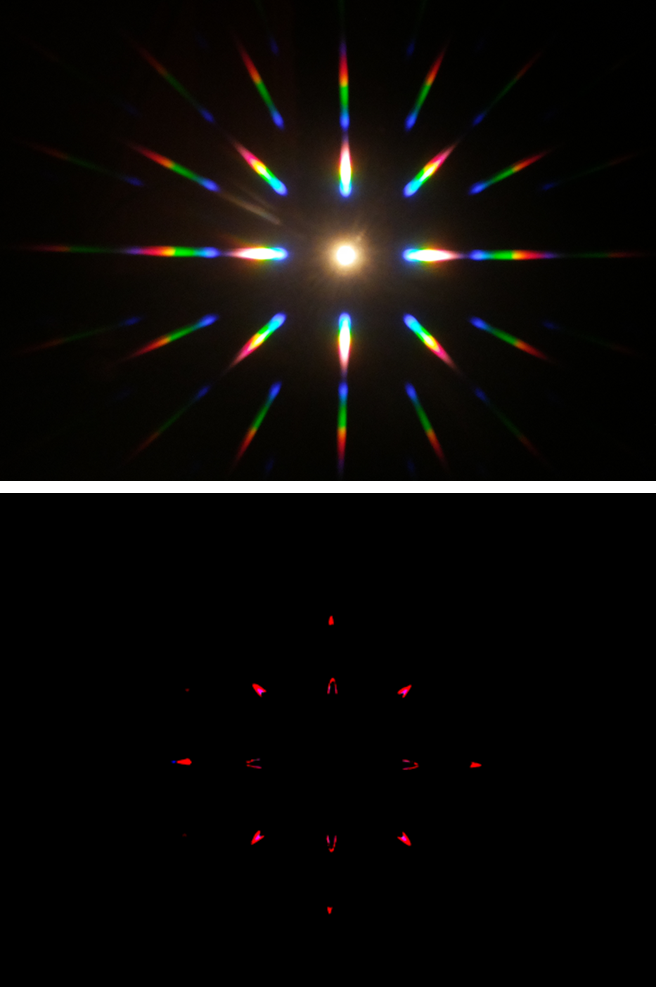
A crossed grating arrangement was used to observe multiple diffraction orders across a wide range of signal levels. A crossed grating was made by combining two transmission gratings at right angles.

The picture below demonstrates red/green/yellow/blue color detection for a white light LED /crossed grating spectrum.

The picture below is a close up of the red color pattern described above. Note color contours around saturated pixels that are difficult to observe in the multicolor input image.

NDVI example:
The picture below shows color detection applied to a NDVI image. Red indicates healthy plant life.

Summary:
Two examples demonstrate how color detection can be used to isolate HSV patterns/ranges. The ability to detect and isolate colors can be used to guide image analysis and establish colorspace values for automated computer vision identification.
Software code posted at: https://github.com/MargaretAN9/Peggy/blob/master/Image%20Processing/HSVcolortrackbar.py
0 Comments
Login to comment.