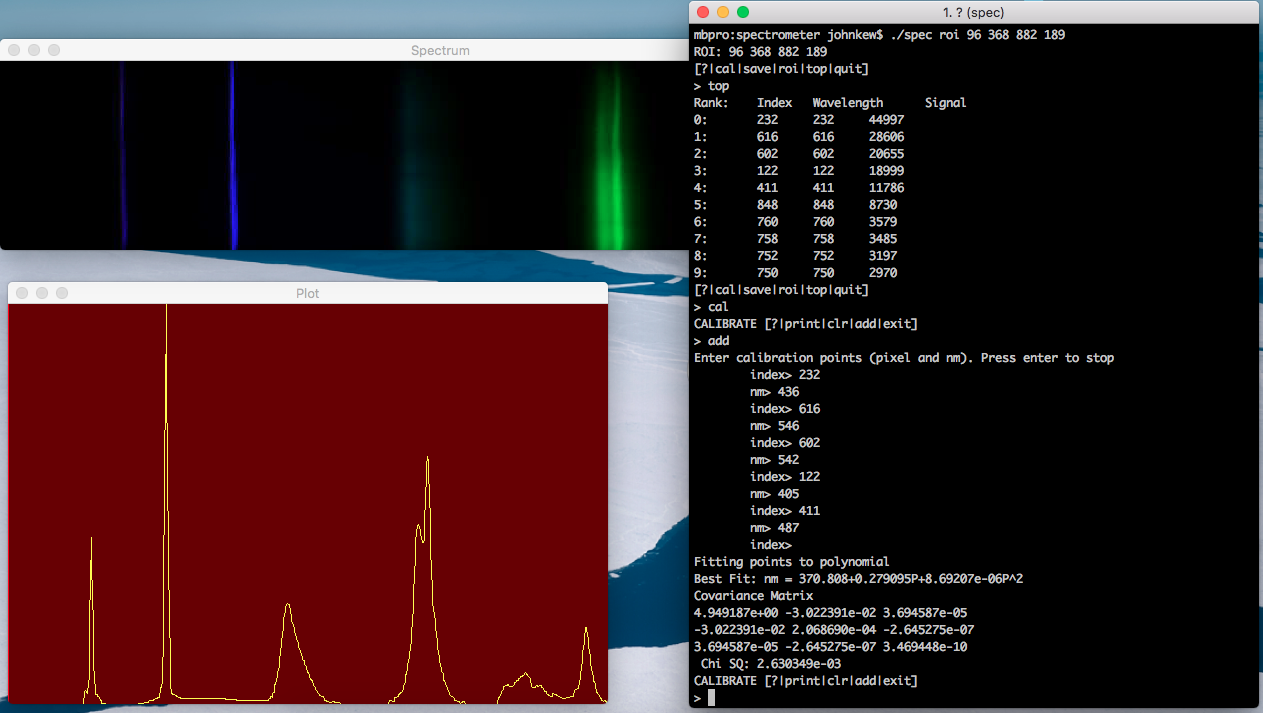
I wrote a quick program to capture spectrums from a DYI Lego spectrometer I built using OpenCV and the GNU Scientific Library. It's pretty rough; but it helps me automate parts of the experimental process in a more fluid way. It does explicitly not support subtraction or other analysis; for that I will be using Tableau; but for data acquisition in a repeatable way I needed something that would let me quickly iterate through a number of samples.
5 Comments
This is so cool!
Reply to this comment...
Log in to comment
Excellent data!!
What direction are you headed for analysis? Absorbance, transmittance, reflectance, or some of the ratio stuff done with other analyzers? It's a lot of work. Good start.
Is this a question? Click here to post it to the Questions page.
Reply to this comment...
Log in to comment
I'm specifically looking at tracking carbohydrate metabolism in bacteria. Early on I'll just be using phenol red which is a clear indicator when acidity changes - but the changes in color are subtle enough that I wanted to actually see a clear response from the phenol red crystal and hopefully detect other types of by-products.
I'm using a halogen for the light source and while I have a number of leds at specific nm ranges I almost think the CFL is good enough.
Reply to this comment...
Log in to comment
Here are some calculations. Don't know if they will help... Btw, I noticed the halogen, and would suggest holding on to it. At least until other testing is done.
These instruments usually "synthesize" a double beam spectrometer by first running a blank of something like water. This blank is then memorized. The known is then run and the ratio of ( known/ blank) is calculated across the whole spectrum. You can then play math games to get absorbance and all the other scales. A lot of the old blood analyzers would take the absorbance in an interesting area of the spectrum and divide it by the absorbance of an "uninteresting" area of the spectrum. This uninteresting area was usually 300 to 310 nm, give or take. The interesting area depends on where the sample absorbs light..i.e. run a spectrum, if nothing else. Good luck
Reply to this comment...
Log in to comment
Ratio= (absorbance interesting area/absorbance uninteresting area )
Reply to this comment...
Log in to comment
Login to comment.