Introduction
Spectroscopy is one of the scientific instruments that rely heavily on experimental principles while at the same time have supported and enhanced several theoretical concepts in physics. It is no less important than Telescopy and Microscopy. What we are dealing is in general called as Analytical Instrumentation. Moreover scientific projects have many times integrated instruments from these closely related fields to create new kinds of instruments that surpass the advantages and limitations when used seperately.
One can understand that by visiting Observatories - from optical, solar, radio, to Micro/Nano science instruments. One could easily understand such large scale integration of modular instruments is possible because of the underpinning rationale contributed by theoretical and practical Energy Level Transitions.
Basically, it explains with what energy what binding can be stimulated. With more and more energy molecular/atomic/subatomic particles can be separated from each other for a brief duration before reaching the stable ground state again. Depending upon these transitions, several interesting phenomenons can be observed in the microscopic universe of materials and their interaction with electromagnetic energy.
So, every material is constantly being in interaction with the Electromagnetic energy. Depending upon the energy level, either translational, vibrational, rotational, electronic excitation is made possible for constituent molecules and atoms in the material. This material is what we call as SAMPLE, which is the "stuff" we would like to inspect at. Which excitation we are going to observe is based upon the sensing material which we have engineered with well known and understood properties, which we call as DETECTOR.
This inspection can be either temporal or spatial or spectral or combination of those. Moreover, inspection can be scaled from microscopic measurements to macroscopic measurements by changing the configurations of the instruments based on the operating environment and application requirement.
Actual thing :)
Thus to create any instrument basically either the individual or the team has to basically understand Systems Integration point of view, how the control and signal is handled through every modules within integration. In the case of designing a spectrometer, before going to actually building a spectrometer having a abstract level view of how it can be actually configured will be helpful.

Thus instead of boring you, lets look at the above listing illustration and observe :
- Excitation Source
- Sample Placement
- Collimation
- Dispersion or Diffraction
- Manual Observation & Observed Spectrum
- Electronic Detection & Measured Spectrum
One can see, **Excitation Source **acts as the source of Electromagnetic energy that we have decide upon which part of the Energy spectrum we like to experiment with. This usually varies upon the application requirement. Thus a clean understanding of classification nomenclature of electromagnetic spectrum we humans have named to easily remember huge bunch of wavelengths, so that applications and requirements can be easily mapped to find the required wavelength necessary, from which the matching excitation source can be found or to be developed with further research. The following XKCD illustration might help remember it easily.
Next in line is the Sample placement. Electromagnetic energy (light wave or photons) passes through this sample where the actual beautiful psychedelic interaction between the matter and energy happens. This usually happens in a near ideal environment or in a closed space or in vacuum or just in open space. Depending upon the material constituents in the sample, the interaction can be interpreted or perceived as : Absorption/Transmission, Emission, Reflection, etc... and sometimes spectrometers are named after such phenomenon.
In order to collect the interacted result which are the photons or wave that comes out after the interaction, proper channelling has to be set. This channel medium depends upon again the electromagnetic energy we are dealing with. Since we like to deal with Infrared, Visible, Ultraviolet, we can easily fit this into Optical devices such as Collimating lens, focusing optics, Iris, Optical guide, etc... For other spectrum like Radio suitable mediums like antennas, waveguides, etc needs to be employed.
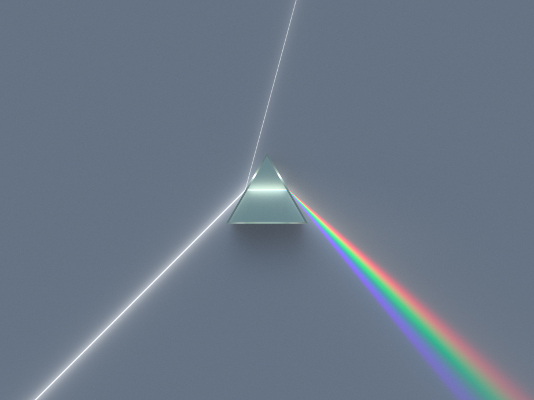
Next comes the heart of the instrument, which is where the engineering research, that actually decides the probing architecture. This spans from Prism, Grating, Prism-Grating-Prism, Volume Phase Grating, Acousto Optic Tunable Filter, Liquid Crystal Tunable Filter, Electro Optic Tunable Filter, Surface Acoustic Wave Filters... etc... These awesome devices are
the result of several experimentation from the world of material science and advancement of synthesizing processess. Each devices handles revealing the composite spectrum that it receives differently - Diffraction, Interference, Refraction, etc... Studying how to design such devices itself a wonderful scientific exploration. They are the backends of the spectrometry.
After revealing the spectrum, we now have to collect them properly and record as measurement. This can be employed in two ways.
- Using highly advanced Intelligence in the known universe, trained eyes (if safer) to observe with its retinal sensing
- Using electrical, electronic, informational devices nurtured by the above intelligent beings to measure properly
To reduce the measurement error, and for better safety often human observation is updated with the electronic and informational devices that offers many other advantages. Again this can be either analog or digital in terms of its implementation.
NOTE:
- To Read more - Cosmobird [Web article]
- How to Design a Spectrometer - \Alexander Scheeline [Journal paper]\
- Spectrograph Design Fundamentals - \James JF [Book]\
3 Comments
Reply to this comment...
Log in to comment
This is a great diagram (the first one, not the XKCD one although that is also great), did you draw it or is there another source i should cite?
Is this a question? Click here to post it to the Questions page.
Reply to this comment...
Log in to comment
i have collected individual icons from noun project, wherever needed with proper credits to original designers from the webpage in my portal. remaining are drawn. for diagram as a whole shared with cc by sa. it is recursively credited back to individual designers of each icons.
Reply to this comment...
Log in to comment
Login to comment.