Abstract
Quality sample preparation is a critical element in the analysis of spectral data, so too, is the knowledge and techniques administered by the individual doing the analysis. I started doing this a little over 5 months ago, with no experience in spectrometers or their usage, only a vague understanding in their operation. I have a chemistry and engineering background, but this was a very challenging endeavor. I certainly made it a goal to learn and perfect my techniques so to improve the quality and reliability of the data I collected and presented.
This study involving rhodamine b is a milestone for me, because I believe through the data I present here, that I have reached two of my main goals, one was to test the accuracy and quality of the spectrometers I built and worked with and two, accuracy and quality sample preparation on the chemistry side of things.
Sample preparation
To prepare a 100-ppb standard of rhodamine B or other dye in powder form: 1. first, prepare a 100-fold dilution by weight. Using an accurate laboratory scale, weigh 1 gram of dye directly into a 100-ml volumetric flask. Then dilute to the mark with distilled water. (Be sure to mix thoroughly; the powders can be difficult to mix.) You now have a 10-g/liter (10-ppt, 10-2) -concentration of your tracer.
Note: You could obtain the same -concentration by weighing 10 g into a 1-liter flask, or 20 g into a 2-liter flask. 2. Next, pipette 1 ml (or weigh 1 gram) of the dilution in #1 (10-2 or 10 ppt) into a clean 100-ml volumetric flask and dilute to the mark with distilled water. Mix thoroughly. You now have a 10-4, or 100-ppm, dilution. 3. Now, pipette 1 ml (or weigh 1 gram) of the dilution in #2 (10-4 or 100 ppm) into a clean 1-liter volumetric flask and fill to the mark with system water. Mix thoroughly.
You now have a 10-7 (or 100-ppb; 0.1-ppm) standard.
Instrumentation - DH 4.2 homemade spectrometer (build 4.0.1)
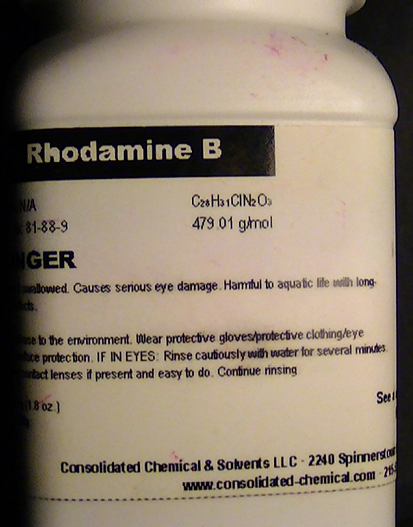
Rhodamine B - (consolidated chemical)
Ethanol - 95.5 % purity (lab grade)
Discussion
From the chart on figure 1, we can clearly see a steady and linear slope of concentration levels for our samples of Rhodamine b. starting from our reference sample which was the rhodamine b standard solution of 100ppm @ 1ml, then descending to our final dilution of 0.06ml.
The master reference used was figure 4, our calibration curve for rhodamine b in ethanol done at the Oregon medical laser center, this reference is the one used to calculate the quantum yields of the other samples for accuracy.
My target in this study was one: accuracy test of my spectrometer, two: finding the correct dilution quotient of rhodamine b for matching the quantum yield of 65, calculated by the Oregon medical laser center, in the upper right hand corner of figure 1 displays the concentration levels of samples 1 through 5 and their respective quantum yields. Sample 5 was the one found to be the correct dilution for having a quantum yield of 65.
Figure 3 shows the calibration curve is very close to the one in figure 4 (the Oregon medical laser center.) This is important, because it further establishes that the techniques and standards that I am using are valid.
The methods utilized for data evaluation is what is called “linear regression analysis”, by this I mean, it’s a method of data evaluation that enables us to create a linear plot of absorbance data versus concentration for a series of solutions. This plot can be used as a measure of compliance with the Beer-Lambert Law and to predict the concentrations of unknown samples.
The plot generated by the linear regression method is called a standard curve, and is described by the equation y = mx + b, where m is the slope of the line, b is the y intercept, and x, y are the data points. Because all data may not be perfectly linear, a measure of how well the regression line fits the actual data points, called the correlation coefficient (R2), is also determined.
Conclusion
As stated in the above section for sample preparation, our standard solution of rhodamine b is 100ppm; the 1 ml sample which is our reference is @ 1 ml and 100ppm using the calculation: PPM in proportion of weight measured in water. Molecular weight of rhodamine b is; 479.01 g/mol (1 ml = 1mg [1ml/1000 = 0.001] so 1ml X Mg/m3 = 0.00100PPM.
Sample 5 [0.06 ml] was at 60ppm and sample 2 [0.5 ml] was 50ppm. These calculations were done after normalization of data during processing.
My first target goal; accuracy test of my spectrometer, successful. My second goal; finding the correct dilution quotient of rhodamine b for matching the quantum yield of 65, calculated by the Oregon medical laser center, successful.
References
http://omlc.org/spectra/PhotochemCAD/html/009.html - rhodamine b in ethanol
http://www.thermofisher.com/search/supportSearch?type=Spectra+Data&query=6393ph8
http://web.usm.my/jps/22-2-11/22.2.6.pdf
http://www.turnerdesigns.com/applications/fluorescent-dye-tracing-application-notes
http://www.lenntech.com/calculators/ppm/converter-parts-per-million.htm

0 Comments
Login to comment.