I finally made time to test @mathew's prototype Oil Testing Kit attachment for the Public Lab Spectrometer v3.0, and here are my results.
The basic procedure I followed was:
- prepare all provided samples
- scan each one
- choose an "unknown" from them, prepare in the same way
- compare to known samples to try to figure out what the unknown is
This went well, although not perfectly. We'd expected that we'd be able to tell crude oil from diesel and various motor oils, but that distinguishing motor oils might be difficult. But our eventual goal is to distinguish crude oil from other petroleum types as well as from other kinds of false positives.

The knowns
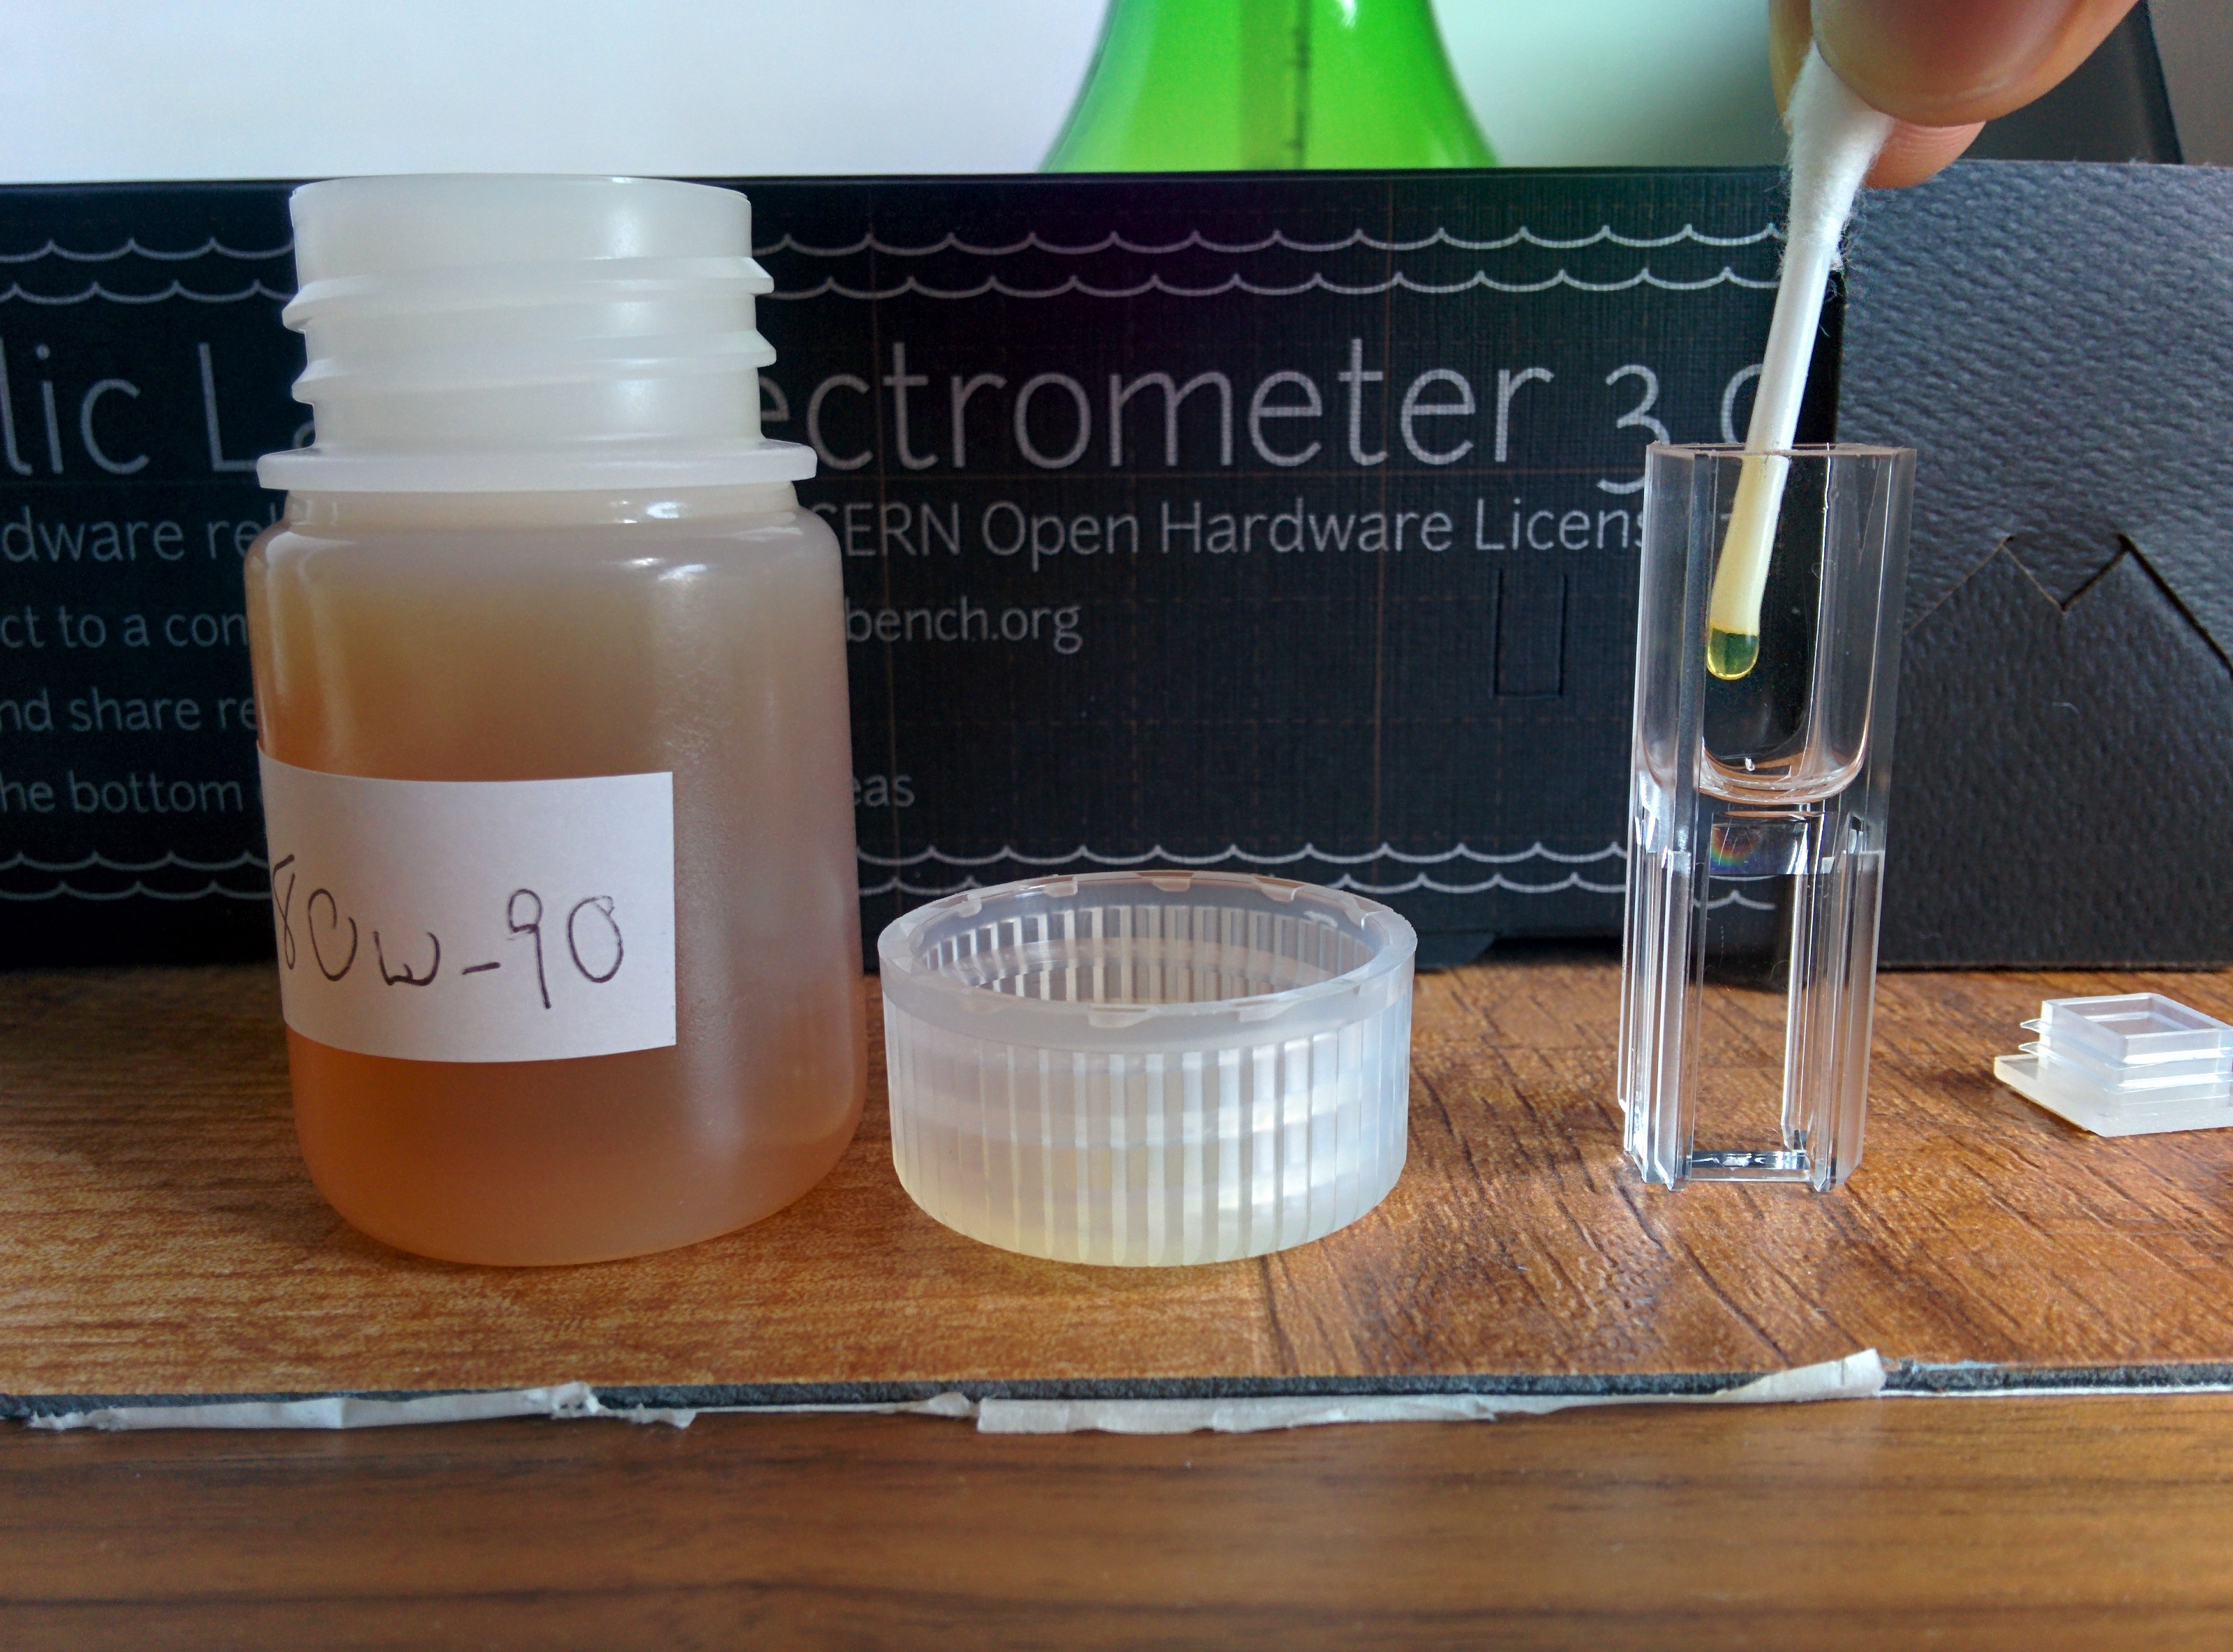
I generally followed the steps outlined in @mathew's original test, which predates the new OTK attachment. The attachment made this test much much easier, but there were still a few hiccups. I began by scanning each of the provided samples, pictured above. They are, in order of "weight":
- Diesel fuel
- 5W30 oil
- 20W50 oil
- 80W90 oil
- North Dakota crude oil (from ONTA)

This went well, although I noted that it took quite a while for the oils to evenly distribute into the ~10ml of mineral oil in the PMMA/acrylic cuvettes. (These and many other supplies are included in the Oil Testing Kit.) I also had only one eyedropper, which I kept clean (mineral oil only) and I used cut-in-half cotton swabs to transfer drops of sample into the cuvettes. I used the plastic tube end, not the cotton end, and some samples were more viscous than others and easier to get drops of -- the diesel was hard, for example. And of course, I used a fresh swab for each oil!

Quantities
When I first tried to scan them in using the new OTK frame (pictured), some of the samples didn't fluoresce strongly enough to get an overall brightness between 25-75%, as we recommend in the Oil Testing Kit docs. However, I just added more drops until they were bright enough. I didn't actually have to use the attenuator strip provided, but it's nice to know it's available for fine-tuning the exposure. I had to add:
- one tiny drop (1/4 of a drop?) of the crude (or it'd have been too dark -- this fluoresces like crazy, so it was fine)
- 3 drops of 5w30 and 20W50 oil
- 4 drops of 80W90
- 8 drops of diesel
Note that the amounts don't seem to correlate with the weight of the samples -- or if they do, 80W90 bucks the trend as presumably the heaviest motor oil, but needing more than the lighter 5W30 and 20W50.
Here's what they look like, raw. (link to set here) I calibrated them all, smoothed them with the "auto-smooth 10 pixels" feature in the More Tools menu, and added them to a set. I did choose cross sections that did not have very bright laser peaks at ~400nm, although there are still some in the motor oils (5W30,20W50, and 80W90).
The differing amounts of sample could be a concern in the differences between our data, but they don't correlate with anything in particular. I don't think, for example, that we're just seeing a trend due to the concentration, as the spectra with the most drops are still the ones with the weakest spectra, despite the fact that adding drops increases brightness.
What we do see is that generally, the crude is out to the right, with longer wavelengths, and that as the oils are lighter, they have a less pronounced "hump" at around 470 nanometers. The humps themselves, or rather the dip preceding the hump at about 450nm, may be an artifact of the blue and green curves meeting in a kind of "saddle" between peaks -- each is detected in different cells of the Bayer filter -- but generally a larger hump indicates that the data skews right.
The unknown
It was impractical (nobody's here to help!) to completely blindly choose a sample, so I turned the bottles around and chose one of the orangish ones, which look pretty much the same unlabeled. I can clearly tell the diesel and crude, but those are supposed to be the easist to distinguish anyhow, so my narrower "blind" test is a harder challenge.

I picked one, prepared it (five drops, since that's what 2/3 of the middle-weight oils needed, so it's a reasonable guess) and scanned it in. In the set embedded above, you can see the unknown alongisde the other samples, but as we found in our work last summer and improved on last fall, it's very helpful to equalize either the maximum height OR the area under each curve, for comparison. This is complicated by the spike from the laser light, but when you equalize area, this is what you see:

From looking at both graphs, a few things are apparent.
- the new embed graphs are WAY more readable, so I look forward to finishing my work on that so the analysis page is easier to read and use
- on the raw, unequalized graph, the unknown fell between 20W50 and 80W90
- on the equal area graph, from visual examination, it seems to be most similar to 80W90
- in both graphs, it was clearly quite different from diesel and crude
The laser spike was a big problem -- it throws off the height equalization and likely the equalize area adjustments too. I realized that we should have a means to equalize area only between 410-700 nanometers, just the way we created the "find graph center" in our work last fall. I'll see about making a macro to do that, soon. For a look at some published research @mathew and I looked at while developing this comparative method, and about a technique we found for grading by graph center, read this note.
Still, my best guess was that it was 80W90, with 20W50 as a second guess. I turned the bottle around, and it was 20W50 -- so my guess wasn't perfect, but it was easy to tell that it wasn't crude.
Next steps
So, pretty good, but there are some clear things we can do next to improve:
- bracket the equalize-height and equalize-area tools to 410-700nm to avoid the effects of the laser peak on these adjustments
- complete my work on the new graphing interface and display to improve readability
- possibly standardize our guidelines for how much sample to add to a cuvette full of mineral oil
Thanks, any comments/critiques welcome -- esp. noting things I've overlooked!
4 Comments
the 80W-90 looks a bit clipped in the blue: https://spectralworkbench.org/spectrums/55075
the crude is substantially clipped in the blue: https://spectralworkbench.org/spectrums/55072
Didn't think i'd have to remind you of this given we worked together to make a warning/reporting system precisely around this issue: https://publiclab.org/notes/warren/10-21-2014/spectral-workbench-previewing-and-clipping-warnings
Reply to this comment...
Log in to comment
I don't believe those are clipped - I increased the exposure until it just barely touched the top, but did not depress or deform the top of the curve - this was to ensure very high dynamic range of data, and in the 2nd one above (crude), it enabled us to get the red channel data even though the blue channel was quite strong. Do you think we really need to back off well away from 100% even if the curve shape is unaffected, and why?
Is this a question? Click here to post it to the Questions page.
Reply to this comment...
Log in to comment
Thanks for your feedback!
Reply to this comment...
Log in to comment
the crude looks really clipped-- I know there's a dip in the middle but it is really topping out.
Reply to this comment...
Log in to comment
Login to comment.