Sensor journalism is a new field of reporting that has opened a door of endless possibilities. It is a new way to approach the world and its problems, and a new way to garner solutions to these problems. While the groundbreaking concept presents many opportunities, it has its shortfalls. There are many ways in which sensor journalism can generate a wide variety of errors. Luckily, since the field is so new, there is time to work out the kinks. By recognizing sensor journalism’s opportunities and challenges, journalists and scientists alike can work towards a more legitimate and precise sensor journalism.
Sensor journalism, as defined by Lily Bui, an M.S candidate at MIT, is “generating or collecting data from sensors, then using that data to tell a story.” There are two components to this definition: the generating/collecting and telling the story. Both components have a so-called pros and cons list. First, collecting data from sensors (the basis of sensor journalism) presents many opportunities. In some cases, doing so can be cost efficient, like in the case of the Riffle Coqui sensor. This type of sensor is categorized by the Tow Report on Sensor journalism as “DIY hardware development”. Instead of trying to access or collect data via expensive equipment, journalists can create their own, and often inexpensive, sensors to gather the data themselves. In JR-368, a data visualization class at Emerson College, my classmates and I used a Riffle Coqui sensor to test the conductivity of water samples taken in Boston, Mass. Simple sensors such as the Coqui, can cost from about $50 to $100, making the process fairly inexpensive. Cost efficient sensors can make data stories easier for less-established news organizations as well as individual journalists.
DIY sensors can also aid in collecting data when data wouldn’t have otherwise been collected. For example, during the 2008 Beijing Olympics, the Chinese government refused to divulge any information regarding the country’s air quality. Journalists took matters into their own hands and created sensors to monitor the air quality and developed a story from their results. But, DIY sensors have a few pitfalls, such as building the sensor incorrectly. Journalists are most likely not well-versed in basic engineering science, meaning there’s a lot of potential for things to go wrong. If the sensor is built incorrectly, the data might also be incorrect, leading to problems especially if the data is published.
Journalists also aren’t statisticians, meaning they may misinterpret data (like in the case of the water conductivity sensors to be mentioned later on). Misinterpreting data can completely transform a story and its meaning. The same goes for misinterpreting a story. Even if a journalist adds a disclaimer to an article, stating that the data collected isn’t 100 percent accurate, readers may still interpret the data to be sound.
The water conductivity experiment done by my data visualization class at Emerson College also had a lot of room for error. Here’s a condensed overview: the class divided into two person teams and collected three water samples around the Boston area. This resulted in about 30 samples (some were from the same spots). The samples were kept in a room for two days before being tested in order to establish a base temperature. They were then tested for conductivity with Coqui sensors through sound. The higher the conductivity in a sample, the higher the pitch was in the sound echoing from the Coqui’s speaker and vice versa.
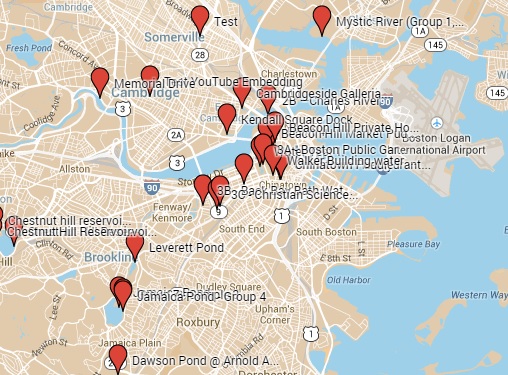
In my group, we tested water from the Boston Public Garden Duck Pond, the Christian Science Center Reflecting Pool, and from bathwater in a Back Bay apartment. We found that the Christian Science Center Reflecting Pool had the highest conductivity. When we listened to other samples, we realized that although our sample from the reflecting pool sounded very high in comparison to our other samples, it was relatively low compared to other samples in the class. So analyzing our own samples without listening to the rest of them could have created a misleading data set.
We were unsure of the temperature of the class’s samples because we didn’t have access to a proper thermometer. Temperature plays a big role in conductivity, so it’s possible our readings were inaccurate. In fact, there are many factors that play a role in conductivity, and it would be hard for a class of journalism students to understand why this is. Plus, we collected a wide variety of samples-- fresh water, salt water, bath water, puddle water, etc. There was no control in our experiment. But while it was established that conductivity is directly related to the amount of dissolved solids in a liquid, it was unclear as to what the amount of conductivity really meant. For example, high conductivity could mean that a water sample was polluted, but it could also mean that it was simply a warmer temperature than the other samples. Therefore, the class didn’t really collect any data that could illustrate a trend or create a story. We didn’t know about water pollution or contamination-- we simply knew of the samples’ (possible) conductivity levels.
So, we didn’t really know much. There were many unanswered questions. What does conductivity really indicate besides the ability of electricity to pass through the samples? Were our samples’ temperatures the same? Were our Coquis accurate? What tells you if water is polluted? Although we couldn’t actually put a story together from the data collected, I think it had one real-life application besides being a fun learning project for the class. By detecting conductivity in certain bodies of water, we can alert officials to these conductivity levels. If I thought the Christian Science Center Reflecting Pool was extremely polluted, asking city officials to test it might not go anywhere. They’d probably dismiss my request. But testing the water gives me some credibility to pursue it. If I approach officials and show them that the water seems to have high conductivity, it might be a good enough reason for them to check it out and do an actual reading of the water. I see the tests we performed as bargaining chips in a sense, an “I’ve detected something that needs to be tested further” type of deal.
While our class may have not stumbled upon Boston’s next water pollution scandal, we learned a great deal. I now have a firsthand look at how sensor journalism operates. I was able to clearly see all of the things that can do wrong with data collection and analysis. I’ve differentiated between good data and bad data, and I’ve worked to collect data that ultimately had no purpose. I think these are all things that sensor journalists need to encounter in their work. And frankly, I’m glad I’ve got a lot of mistakes out of the way early in the game.
0 Comments
Login to comment.