I had a great long chat with Mark Brownawell at the Artisan's Aslylum. Mark has a long career designing instruments, and he had great insights into every project idea I brought up. Here's one of them:
When I mentioned to Mark that we're trying to use a 555 to measure conductivity, he had a lot of useful things to say, and one of them was to point out that the way we'd hooked up the circuit, the 'duty cycle' of the 555 output square wave isn't '50%'.
That sounds fairly technical. What does it mean?
Duty cycles and conductivity
'Duty cycle' is the amount of time that the oscillating circuit output spend in the 'on' vs the 'off' state -- there's a great explanation of it on Wikipedia, here.

(Courtesy, SparkFun).
Note: most of the graphics I'm showing later in this note derive from a wonderful online explanation of duty cycles and the 555 timer, learnabout-electronics.
For the 50% duty cycle above, you can see that the output spends the same amount of time on as it does off.
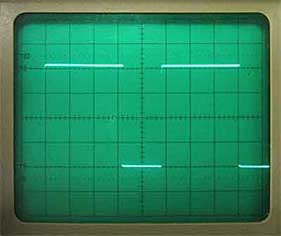
In our case, our circuit is set up so that it isn't necessarily 50%, but has a duty cycle that ranges from 50% to 100%, depending on the frequency. That is, if we were to measure the current we're sending through the water for a few milliseconds, and plotted that current out on an oscilloscope, we'd likely get something like this:

The amount of 'on' time vs 'off' time isn't the same -- it's not a 50% duty cycle. This isn't ideal for what we want to do (measure conductivity), because it means that the electrical current flow through the water isn't unbiased: for every second that the circuit is turned on, there's a longer current flow in one direction than there is in the other, which could result in polarizing the water sample (and more corrosion on electrodes). Worse, the amount of bias is a function of conductivity / frequency, so the amount of bias will change depending on the sample's conductivity.
Let's make it ... 50-50
Mark pointed to a configuration of the 555 timer that dials in a 50% duty cycle:

WIN #1: Simpler Circuit
This configuration drops one of the resistors in the circuit. So, this is already a win, because the circuit is simpler to assemble. But get this ...
WIN #2: Circuit output is easier to understand
In our previous circuit, the equation relating frequency to the resistance of the water was:
freq = 1/(.7(R1+R_water)C)
This meant that when trying to figure out the 'cell constant' for our conductivity probe, and understand the relationship between coductivity and frequency, we had to fit a nonlinear curve, like this:

(graphic courtesy Jeff Walker)
Alternatively, if we wanted to calibrate the probe using a reference tone and a reference saline solution, our only option for tuning the circuit appropriately would be to change the conductivity probe itself (by moving the position of the electrodes, say), which is really awkward. (Thanks to Jeff Walker and Jiansheng Feng for their helpful insights into this.)
With this new, 50% duty cycle circuit, however, the equation for output frequency as a function of the water resistance now becomes:
freq = .7/(RC)
The conductivity, S = cell_constant / R, where the cell_constant comes from the particular metal and geometry of the conductivity probe (e.g., the screws, and their spacing, in the bottle cap.
Plugging in, we get:
freq = .7 * S / cell_constant * C
A simple, linear relationship between frequency and conductivity, where the slope is .7/C -- wow!
I.e., our new plot of frequency (y-value) vs conductivity (x-value) is just a straight line:

Where 'm' is equal to .7/C, with C being the capacitor we use in the circuit. Simple!
This means that the output of our 555 circuit is far easier to intepret. A plot of frequency vs conductivity will yield a straight line. And the circuit is very easy to tune in range -- the slope is .7/C, so if we want to keep our frequency values in a certain range (audio, say), we see how to change our capacitor value accordingly. For example: larger R_water in the denominator will mean that the frequencies go down; to bring them back up, we can use smaller C in the denominator. This is nice!
But it also means ...
WIN #3: Easy calibration
EDIT: This idea below doesn't work, because: math. See the comment section for a calibration idea involving a trimmer capacitor that should work!
We can now calibrate a 555-based measurement device by adding a single potentiometer in series with the resistance being measured. Before, our only option to calibrate conductivity probes was to fiddle with the geometry of the probe. But now, by adding a resistor to the circuit, we get:
freq= .7/((R_tune+R_water)*C)
The difference between DIY probes will show up in R_water; by tuning R_tune, we can compensate for these differences. NEAT!
More explanations / examples of all of this forthcoming, soon ...
Thanks again, Mark!
Cheers, Don
15 Comments
This is great news!!! And well presented!
Reply to this comment...
Log in to comment
YES! :) I was dancing around with glee last night when I saw the equation for freq vs. resistance and capacitance for the 50% duty cycle!
Reply to this comment...
Log in to comment
(maybe that should prompt me to reconsider my life direction?)
Is this a question? Click here to post it to the Questions page.
Reply to this comment...
Log in to comment
this is super excellent. does this mean that people can assemble DIY probes with slightly different relationships that we can now tune to standard saline solutions? does this eliminate the need to manufacture a precise probe?
Is this a question? Click here to post it to the Questions page.
Reply to this comment...
Log in to comment
Yes! And before, when we had a different relationship between freq and conductivity, the only way to do that tuning was to tweak the probe -- and Jeff W had a great idea re: e.g. placing probes on a ruler, and tweaking. But now, we can just add a potentiometer to the circuit, and tune the frequency output of a standard saline solution (contact lens / Perrier / etc) to match -- done. Woohoo!
Reply to this comment...
Log in to comment
UPDATE:
We can dial in the capacitance! Ben pointed me to the fact that 'trimmers' exist:
http://www.mouser.com/ProductDetail/Murata/TZB4R500EA10R00/?qs=L1r%2FWTctu%252bhtHRbzGVpgrg%3D%3D&gclid=COzBko2P7MACFZJr7Aod_CkANA
So, we replace C in the equation with a trimmer ... and then everything will scale accordingly!
This is also nice b/c it allows us to change the overall sensitivity of the circuit, too ...
Is this a question? Click here to post it to the Questions page.
Reply to this comment...
Log in to comment
My endocrine system can't handle all of these ups and downs. But tonight ends on an up.
Reply to this comment...
Log in to comment
Ah darnit, I deleted my comment above by accident, instead of editing it ...
Okay, the punchline is:
The only ways to compensate for the effect that variations in DIY probe designs have on the measured conductivity seem to be a) changing the geometry of the probe, or b) changing the capacitance. We can dial in small changes to the capacitance with a 'trimmer' (linked above). So, looks like maybe: if your probe is way off, alter the geometry until you're in the ballpark; then make fine adjustments with the capacitor trimmer. We'll need to figure out how 'off' various probes might be ...
One thing we could do is distribute a little 'smiley/froggy face' label that people can put on e.g. a bottle cap as a location to place screws, as an easy guide, in order to get everyone in the same ballpark ...
Reply to this comment...
Log in to comment
very good news :)
Reply to this comment...
Log in to comment
Here's an example of a cheap, through-hole 'trimmer capacitor':
http://www.amazon.com/Through-Trimmer-Variable-Capacitors-Brown/dp/B00G9BJTJW/ref=pd_sim_indust_3?ie=UTF8&refRID=1A7CFQMJWGW3A7TWF9KV
The trick will be figuring out what range is needed. We can probably do this by building a few DIY probes with a given value of the capacitor C, place them in some standard solution (contact lens solution, say), and seeing how much the frequency changes across changes in geometry and probe material. This will lead to a sort of estimated change in frequency that we need to account for in terms of a change in the capacitor value. Excited to try this!
Is this a question? Click here to post it to the Questions page.
Reply to this comment...
Log in to comment
Your diligence in solving this calibration problem in the most user-friendly way that ALSO involves simplifying the electronics AND the signal output makes me ecstatic.
Reply to this comment...
Log in to comment
Aw, shucks :) But yes, it's so cool that we might find some part of design solution space that satisfies all of these!
Before Ben pointing me to trimmer capacitors, though, I did start to feel that it was actually pretty cool, as per Jeff's idea, to have electrodes on a ruler -- so that the user gets a sense for which physical parameters affect the conductivity measurement (the distance between the electrodes in the water being one of them). Turning a capacitor knob isn't as directly intuitive ... but it still leads down a path to understanding the "RC" part of the oscillatory circuit, and there's no reason we can't also do the 'electrode on ruler' idea, too.
In fact, maybe: first you place the electrodes (screws from the hardware store, fixed with paperclips, as per Jeff's idea) on a ruler, changing their separation until you get into the right frequency ballpark; and then you use this separation distance when placing the screws in e.g. a plastic bottle cap (for rigidity / stability), and use the capacitor trimmer for fine tuning.
It'd be pretty rad if doing things in this way, and generating audio frequencies that get sampled on a smartphone / laptop, leads to a more sensitive and reliable instrument than $40 or even $150 conductivity probes on the market. And those probes don't support 'data logging', whereas we just need to record the audio file (which you and Jeff have pointed out repeatedly). AND the data is directly intuitive, when calibrated against a standard tone -- "middle C" is always 1200 uS/cm, say. This is going to be so cool.
Chris suggested at LEAFFEST that we write up all of the 'benefits' of using audio, and the resistance --> frequency setup, for folks who haven't been privvy to all of our mad brainstorming around this. Let's do that in a wiki / etherpad soon?
Is this a question? Click here to post it to the Questions page.
Reply to this comment...
Log in to comment
yes. we should. It isn't directly evident why we would use audio, given that it is so incredibly data-intensive. We have to make that argument RE:legibility of data, simplicity of processing, intuitive understanding of function vs. Taking up tons of space on a hard drive.
Reply to this comment...
Log in to comment
changing the capacitance is really easy to explain to people. every transition from a peak to trough of the wave form is queued in by the filling of the capacitor. So getting a longer or shorter wavelength depends on adjusting the "depth" to which the capacitor gets filled. Its like adjusting the height of a toilet float in the flush tank so it fills faster/ flushes less.
Reply to this comment...
Log in to comment
Oh, toilet tank analogy is great! @cversek was talking at LEAFFEST about how, in the water <--> electricity analogy, the only sticking point is capacitance. He was suggesting the idea of a rubber bladder. Toilet tank is great, too.
I feel that there's a manifesto be written around 'legible data formats' (like audio frequencies that track a value, rather than encoding a value in some non-intuitive way) akin to the motivations given for the literate programming idea. In the same way that incredible advances in storage capacity and processing power have made the addition of explanatory text to source code a no-brainer now (the compiler can quickly process the file to extract the source code; storage of additional text is not a problem -- but back in the day, constraints of storage and processor speed would make this impossible) -- cf RStudio, Mathematica Notebooks, iPython, the [Jupyter Project], and the community around coffeescript -- we can argue that if storage space is cheap, storing data as audio is not just robust (infrastructure for capturing and interpreting audio ubiquitous) and high-resolution (audio sampling high-res ADC tech is high-quality, cheap, ubiquitous), but means that the data can be easily interpreted, 'sanity checked', and understood across divides of technical background / education / sightedness, etc. We should even put together a short animated video or something. "The Science of Echomimetics" -- 1970s science education style. Inspiration: https://www.youtube.com/watch?v=t4CRCJUmWsM
Is this a question? Click here to post it to the Questions page.
Reply to this comment...
Log in to comment
Login to comment.