What I want to do
Summarize the literature on low-cost passive particle monitors tha can produce data expressible as concentrations by air volume, the kind of data required to take action by the EPA.
I was pointed to these low-cost monitors by Tom Peters of the University of Iowa, whose team worked on developing and characterizing such monitors in the late 2000's. The original design can be traced to Jeff Wagner's PhD research at the University of North Carolina Chapel Hill. Jeff now works with the RJ Lee Group on monitoring using this method.
My main interests are two-fold-- the design and cost of the sampler, and its correspondence with dichotomous samplers that use active pumps and filters and are certified as a Federal Reference Method (FRM)
The Passive Sampler
This sampler is attractive for several reasons; its cheap, it works out doors, its been correlated with FRM methods, and has the option of either using Scanning Electron Microscopy for particle speciation (identification) or a less expensive visual light microscopy and automated analysis in ImageJ for particle size determination [7]
The original design


From [2]:

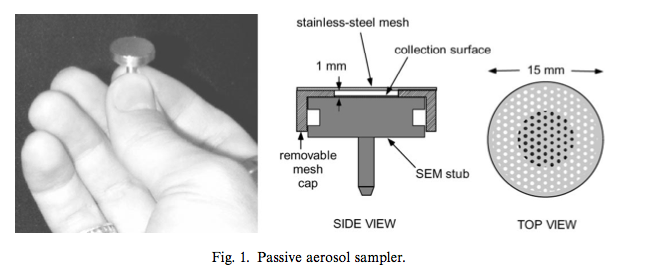
The mesh is stainless steel, with a conical section "160µm (top diameter) and 225µm (bottom diameter) has been selected for general use (Buckbee-Mears, St. Paul, Inc.) However, a range of mesh sizes is commercially available and can be selected with respect to the sampling application." [188, 3]
The collection area is 1.2 mm deep and 6.8 mm in diameter, with a "smooth aluminum tape" for the collection surface, no more detail is specified [196, 4]. It appears to just be a metal surface, without adhesive, so while based on passive deposition it is not a sticky pad. As later tests involved a "carbon tab" "sputter coated" with gold [634, 5]. Ott, Cyrs, and Peters used "A 12-mm-diameter cover glass (Catalog #12-545-80, Fisher Scientific, Pittsburgh, PA)" cleaned with "antistatic laboratory wipes (Model #34155, Kimberly Clark, Dallas, TX)" as their collection substrate, "held within 1 cm above a polonium-210 strip (Catalog #1U200, Amstat Industries, Glenview, IL) to neutralize any static charge." [157, 7].
In wind tunnel tests up to 5m/s, relative humidity and wind speed did not substantially effect measurements in a way that cannot be corrected, however windspeed data was needed. In relation to the impactor tests, the passive monitor was determined to have 18.1% variation for PM2.5 and 32.2% variation for PM10 [200, 4]. All tests on the passive samplers were done with Scanning Electron Microscopy (SEM).

deposition [3]

Early testing by Wagner, et al. demonstrated that there was a high correlation between results from the passive sampler and impactor sampling in indoor environments [2, 4]. The wind tunnel used is described in [4]. Windy environments would require wind speed measurements to correct against.
Enclosures for outdoor operation
Thomas Peters and his team were interested in using passive monitors for outdoor testing that would obviate the need for wind speed data. They developed a housing [6] and rigorously tested it in relation to optical and filter-based dichotomous samplers in wind tunnels and field tests [6, 7, 8].
six different housings were tested in wind tunnels before field verification. From [6]:

Design A, the flat plates, had the best performance.

Wagner adapted a version of this flat plate system [10]:

Correspondence with Dichotomous sampler data
From [7] "The coefficient of variation (CV) of PM10.2.5 measured with collocated passive samplers was 20.1% in laboratory tests and 11.6% in field tests." [156, 7] However, "The somewhat worse precision identified in laboratory tests (20%) was attributed to spatial heterogeneity of particles in the test section of the wind tunnel. Thus, precision measured in the field tests is probably a better estimate of method precision than that measured in the laboratory. " [166, 7] Improved results vs wind tunnel tests in [4] are attributed to an order of magnitude increate in partcle count (100 to 1300 per sample), aided by automated analysis.
Sampling was biased positive for PM2.5 in relation to dichotomous samplers, but the 28.8% CV is systematically biased, and may be a result of the particle density calculations. Scanning Elctron Microscopy may improve the results and move the passive samples within the acceptability criterion of the EPA...
"The data quality objective of the U.S. EPA for the operational precision of PM2.5 monitoring is a CV of 10% or lower (Protection of Environment, 2006, 40 CFR Part 58 Appendix A). Our study shows that 39% of the data pairs for PM2.5 and 36% of the data pairs for PM10-2.5 meet this objective. Precision improves as concentration increases; the percentage of pairs that meet the EPA objective increases to 52% for PM2.5 concentrations greater than 5 µg/m3, and to 40% for PM10-2.5 concentrations greater than 20 µg/m3. Further, 74% of PM2.5 concentrations greater than 5 µg/m3 and 60% of PM10-2.5 concentrations greater than 20 µg/m3 meet the less restrictive CV objective of 15% or lower as specified by the U.S. EPA for measurement uncertainty of PM10-2.5." [12]
Bibliography
Wagner, Jeff. Passive Aerosol Sampling. PhD Thesis. UNC Chapel Hill (2000).
Jeff Wagner and David Leith. Field tests of a passive aerosol sampler Aerosol Science 32 33-48 (2001)
Jeff Wagner and David Leith. Passive Aerosol Sampler. Part I: Principle of Operation. Aerosol Science and Technology 34: 186– 192 (2001)
Jeff Wagner and David Leith. Passive Aerosol Sampler. Part II: Wind Tunnel Experiments. Aerosol Science and Technology 34: 193– 201 (2001)
Darrin K. Ott, William Cyrs, Thomas M. Peters. Passive measurement of coarse particulate matter, PM10-2.5. Aerosol Science 39 156 – 167 (2008)
Darrin K. Ott, Naresh Kumar, Thomas M. Peters. Passive sampling to capture spatial variability in PM10–2.5. Atmospheric Environment 42 746–756 (2008)
Jeff Wagner, Kinnery Naik-Patel, Stephen Wall, Martha Harnly. Measurement of ambient particulate matter concentrations and particle types near agricultural burns using electron microscopy and passive samplers. Atmospheric Environment 54 260-271 (2012)
Peters, Grassian et al. Single-Particle SEM-EDX Analysis of Iron-Containing Coarse Particulate Matter in an Urban Environment: Sources and Distribution of Iron within Cleveland, Ohio. Environmental Science and Technology 46 4331−4339 (2012)
Maiko Arashiro and David Leith. Precision of PM measurements with the UNC passive aerosol sampler. Journal of Aerosol Science 57 181–184 (2013)
Jeff Wagner and Gary Casuccio. Spectral imaging and passive sampling to investigate particle sources in urban desert regions. Environmental Science: Processes & Impacts 16 1745 (2014)
4 Comments
This is a gravimetric sensor:
In theory, don't PM particles have different weight, depending on atomic content.
If you were to use a mesh to restrict the filtered particle size then have them land on a gravimetrically sensitive plate then couldn't you record the gradual increase in the weight of the settled particles, to work out how much of what is in the air at any time? Or is that too complicated?
Is this a question? Click here to post it to the Questions page.
Reply to this comment...
Log in to comment
Usually gravimetric tests are done on particles after they have been captured in the field. Given environmental vibrations, it sounds tough to pick up the fall of a particle in the field.
In this design, the grating appears to be to create a low-wind zone to hold onto particles once they blow in, as well as keep large particles out.
Reply to this comment...
Log in to comment
Markdown In order to measure particles in sand mine areas of W. Wisconsin/ SE Minn., I noticed from a google/NASA map today that average wind speed in this area is 6-7 m/s, at 80 m. Reference: http://maps.google.com/gallery/details?id=zJuaSgXp_WLc.kTBytKPmNODY&hl=en As this is more than the 5m/s above, how difficult is it to compensate for higher windspeed? [I have no idea whether average means mean, median or mode, but I'm guessing mean] Does Tom Peters have a technique, seeing that he's working in windy Iowa?
also, I'm wondering about the design of the flat plate used for collection-the photo reminded me of some of the old techniques used to keep a candle burning in windy conditions. The most effective one I ever saw was one that surrounded the candle in a tin cylinder that had lots of small holes punched away from the candle. The candle got plenty of air, but couldn't be extinguished, even with fireplace bellows. The candle wasn't affected in the windiest conditions, and no dripping indicating drafts or uneven airflow. The question, of course is whether this would impede the particles that you want to get. I'm imagining a plate with the surface of a very fine grater. Memory says these were called the "? betty". Illustration below is the only one I could find. This is a very long shot, I know. ( Trying to light a camp stove at high altitude in the wind above tree line when backpacking made me think of this a lot.)
Is this a question? Click here to post it to the Questions page.
Reply to this comment...
Log in to comment
That candle protector is a great way to picture how this sensor works! I think the tiny grate on top of the sensor itself does something similar. I hadn't really thought of the little grate as being an airflow control device too.
I'm not sure how the two-plate housing is really slowing down flow, except through laminar friction. I'm guessing it somehow slows the particles down enough to normalize the flow through the grate on the top of the sensor.
Reply to this comment...
Log in to comment
Login to comment.