Spectral Workbench calibration
You'll notice that many spectra on Spectral Workbench have a scale showing "nm" or nanometer units on the horizontal axis. To get scaled data, you must calibrate your spectrometer. There are several kinds of calibration but here we're talking about wavelength calibration, which allows your spectrometer to display a wavelength value for any color of light it sees. Luckily, this is easy.
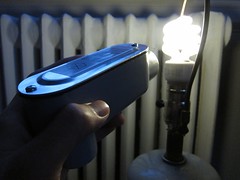
1) Find a fluorescent light bulb -- preferably a compact fluorescent bulb you can put your spectrometer very close to. Point your spectrometer at the bulb -- if it's too bright, point it at a piece of white paper or wall which is brightly illuminated by the bulb.

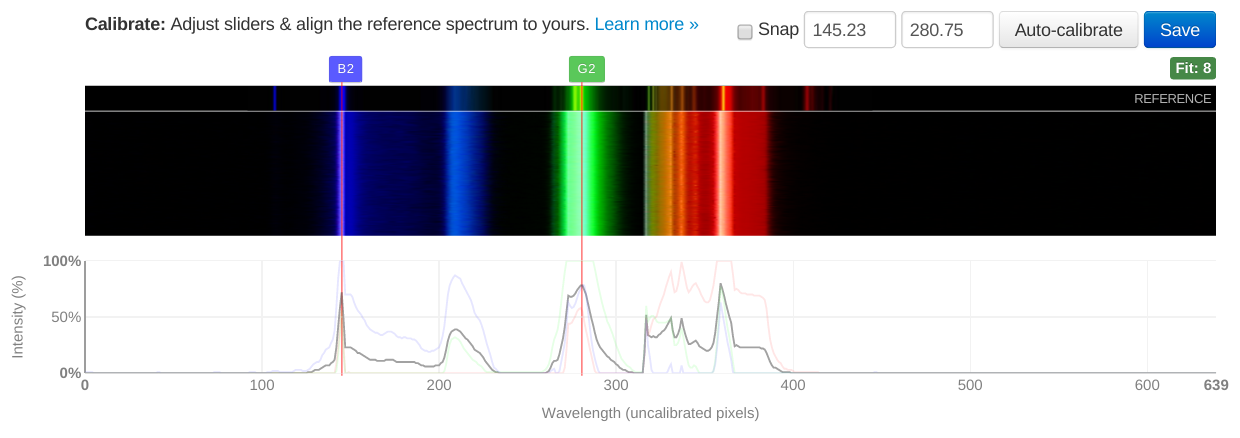
2) You'll see an image like the above example; if you're on a computer, it may appear horizontally. The lines you see are from mercury and phosphors in the bulb, and since we know what wavelengths they should be, we can use this to calibrate your device.
Save this spectrum, and tag it "fluorescent" and/or "CFL". Now you'll need to use the analysis tool to calibrate; it will walk you through the process.
Fluorescent lamp spectrum
You can calibrate your spectra or your spectrometer because the spectrum of a compact fluorescent light bulb is well known. Two lines in particular are very stable and easy to recognize:

- Mercury 2 line: "middle blue line" at 435.833 nanometers
- Mercury 3 line: "bright green line" at 546.074 nanometers
The positions of these two lines in the spectrum of mercury vapor are well known (read about the sources we've used here), and so we can use them as guides or references to calibrate our own spectra of fluorescent lamps, which are primarily mercury vapor. Even lamps with "warmer" colors, like many compact fluorescent lamps (CFLs) will work, as they also use mercury vapor.

Calibrate your spectrum
Click the Calibrate button (as shown above) and you'll be guided through identifying and clicking on each of these lines. Once you've calibrated a single spectrum, you'll be able to apply that calibration to all of the spectra you collected with that instrument.
Watch this video for a walkthrough of the whole process (2.0 video coming soon):

Cross section
Your spectrometer produces a 2D image of a spectrum, but to generate a graph, you must choose a horizontal cross section of pixels to read -- each pixel's brightness is then used to populate a graph of the spectrum's intensity.
The image above shows a yellow line crossing through the brightest part of a fluorescent bulb spectrum. Read below to learn why this is important.
Video cross section vs Image cross section
There are actually two moments when Spectral Workbench chooses a cross section.
Video cross section The first is when you are using the live Capture interface, and viewing a live video feed from the spectrometer, and you must choose a video cross section of the live video image. The live graph you see in the Capture interface is a graph of that cross section of pixels, which is also displayed as the top row of pixels in the 'waterfall display', which shows a descending series of cross sections.
Image cross section The second is when a saved image of a spectrum is used to generate a graph. By default, the first, topmost row of pixels is used to generate a spectrum graph. This makes sense for Live Capture because it is the most recent data captured by the device. However, if you upload a spectrum instead of using Live Capture, this may not be the best cross section -- typically, uploaded spectra are not waterfall displays, but just a photo of a spectrum. In this case, choosing an image cross section is more like choosing a video cross section in that you may want to choose a line that crosses the middle of the brightest part of the spectrum.
Changing the cross section
If you change a cross section after calibrating, the position of each color may not be the same as in your original calibration. This could make your calibration inaccurate, as it relies on the spectrum being in exactly the same place in each image.
However, if you captured your image using Live Capture, the image cross section represents a timeseries of calibrated cross sections, so you may choose any cross section, basing your decision on exposure and other factors.
Brightness
Generally you'll want the brightest part of the cross section, but sometimes that will result in parts of your spectrum being overexposed, where the pixel sensor is overwhelmed with too much light, and your data is "clipped" -- like when a speaker plays too loud a sound and the audio is distorted. Read about this in the Overexposure section.
If this happens, you may want to dim the light source, because to choose a less bright cross-section would mean you need to recalibrate (see above, in "Changing the cross section").
Defaults
Spectral Workbench uses a default video cross section in one of two ways. If you have any calibrated spectra (identified by the calibrated tag), the most recent is used to show a wavelength range on your capture graph. If that spectrum also has a video_row tag, it is used to set the video cross section for new spectra, to maintain consistency. The image cross section for new Live Captured spectra will still be the top row. If there is no available video_row tag, Spectral Workbench will choose a cross section halfway down the image.
For uploaded spectra, Spectral Workbench will default to the image cross section of the most recent calibrated spectrum, if you have one, using the image_row tag, or default to the top row if none exists.
Known issues
There is still a bug in the code that can cause odd calibration results -- Jeff needs to fix it (sorry!). Try pressing "re-extract" than after it clears the previous calibration, clicking "calibrate" again and following the instructions once more. Try comparing your calibration to another (search for "CFL calibration").
Custom calibrations
You can calibrate a spectrum with 2 known pixel positions and corresponding wavelength values with the following URL format:
https://spectralworkbench.org/spectrums/calibrate/SPECTRUM_ID?x1=242&w1=554&x2=483&w2=780
Where SPECTRUM_ID is the ID of your spectrum, x1 and x2 are the pixel locations, and w1 and w2 are the wavelengths for those positions.