Spectral Workbench API

This is a planning page for the in-development Spectral Workbench API.
Purpose
The API (starting with the macro system, below) will make it possible for anyone to develop new functions, like:
- displaying a set of wavelengths (and their intensities) for, say, a contaminant you're looking for
- displaying a ratio of wavelength x to wavelength y -- say, for normalized differential vegetation index (NDVI)
- display intensity at 600nm and indicate intensity at 600nm for the last 10 measurements
- calling up, averaging, and displaying the average of all spectra tagged with "oliveoil" or whatever
- graph intensity at wavelength X over time, for the past Y weeks
- save spectra periodically
- develop a better spectrum matching function (find nearest match)
- make a function which can auto-recognize a CFL spectrum and offer to auto-calibrate
Macros
We're going to start with a simple macro language, probably initially in a sandbox so people can try things out. We'll build out this language for a bit, let it stabilize, and then tackle the problems of publishing macros and sharing them amongst users. You can try the API out now (but not yet save macros) at https://spectralworkbench.org/capture
Getting started
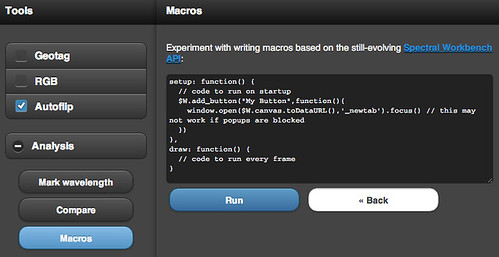
To create a macro we'll have a simple editor you can enter JavaScript code into. At first you won't be able to save, and it'll just be a console "sandbox". The basic template will look something like this:
setup: function() {
    // code to run on startup
    $W.add_button("My Button",function(){ do_something() })
  },
  draw: function() {
    // code to run every frame
  }
A very simple command to run in the macro console (works as of Oct 14 2012) would be:
setup: function() { window.open($W.canvas.toDataURL(),'_newtab').focus()}
Which opens a new tab with the current image data as a PNG. For now, you can use any of the below variables and methods in a Javascript console such as found in Chrome, Safari, or Firebug on Firefox.
Variables and methods
A range of variables and methods will be available to use in your macros. To start with, you can read through the existing framework here:
https://github.com/jywarren/spectral-workbench/blob/master/webserver/public/javascripts/capture.js
- $W.data - returns a nested array of wavelength/intensity pairs, as floats and integers between 0-255, respectively. Example to come; intensities are separated by R, G, and B channels.
- $W.mode - "rgb" or "average", i.e. whether we're currently looking at color channel data or the averaged "monochrome" data
- $W.markers - an array of markers at certain wavelengths, as input by the user. Later we'll make it easy to add new markers (see upcoming section below)
- $W.notify(string msg,string type,boolean expire) - alert the user with a message (msg) of type "notify", "warning" or "error" shown in green, yellow, or red respectively. Defaults to expire = true, which means it disappears after 2 seconds.
$W.getIntensity(obj data,int x) - Get the intensity from 0-255 for a given x-position in the video frame. Use as follows:
$W.getIntensity($W.data[0].data,200) // fetches intensity for x-position of 200 px
$W.calibrate(id,x1,w1,x2,w2) - calibrates the spectrum with id id, using wavelength/pixel pairs. Integer x1 is a position in the x-axis of the spectrum image (origin left) with a known wavelength position of (decimal) w1. x2 and w2 follow the same convention and the two positions are used to linearly interpolate the calibration. Note that this occurs only on the server side, and if you have loaded a spectrum, it will not reflect the new calibration until you re-load it from the server.
- $W.saveSpectrum() - saves the current spectrum of data and brings up the Save dialog.
- $W.getWavelength(int col) - returns wavelength as a decimal for the x-axis position given in "col"
- $W.toggle_mode() - switch from "rgb" to "average" mode or back
- $W.show_rgb() - switch from "average" to "rgb" mode
- $W.show_average() - switch from "rgb" to "average" mode
- $W.add_spectrum(int id) - fetches data from a spectrum with the given ID, and displays it in the graph for comparison
- $W.excerptCanvas() - returns a PNG (data url) of the current waterfall display image
Upcoming variables and methods
- $W.add_button(string label,function action) - adds a new button to the interface which has the given label and triggers the given action
- $W.add_marker(string name,int wavelength) - not yet implemented - add a new marker to monitor the intensity at this wavelength.
Examples
Please add your own if you like:
Saving image data offline
Submitting spectra via POST request
It is possible for logged-in users to POST to: https://spectralworkbench.org/spectrums
with the following parameters:
- spectrum[title]
- tags (comma delimited)
- spectrum[notes]
- dataurl (a dataurl-encoded PNG of the data)
- geotag
- lat
- lon
- device (with values like "device:dsk" which actually just become tags)
- spectrum[calibration_id] (the id -- as in the URL -- of the spectrum to "clone" a calibration from)
This could enable periodic timed submission of data. However, we discourage users from abusing the API by submitting every minute or every second, which might force us to disable this form of submitting data. Please submit only 1 pixel tall images instead of whole images, and submit a maximum of once per hour.
An periodic sampling macro can be found here: https://gist.github.com/jywarren/4945996