Detection of Metals in Water with the WheeStat
Purpose:
General method for determining the concentration of metals (copper in the example data) in water with the WheeStat.
Overview:
There are a number of methods for electrochemical determination of metals in water. One of the most common is to use anodic stripping voltammetry (ASV) with the Standard Additions Method.
The way the Standard Additions Method works is you take a water sample with an unknown concentration of a metal of interest, run an anodic stripping voltammetry experiment on this sample and generate a voltamagram. Then you spike the sample with known concentrations of the metal of interest and generate voltamagrams for each of these spiked sample. From the peak areas of the generated voltamagrams the concentration of the metal of interest can be determined.
Things you will need:
• WheeStat and a computer running the WheeStat software
• Electrodes (working, counter, and reference)
• Supporting electrolyte (something like potassium chloride, KCl)
• Metal of interest (something like copper nitrate)
• Something to accurately measure volume (graduated cylinder, syringe, pipet…)
• Beakers or bottles to make solutions in
• Deionized or distilled water
• Sample to analyze
Method:
The first thing to do is collect a water sample to be analyzed. To do this you want to take a clean container, rinse it three to four times with water from the river/lake/pond/etc. that you will be analyzing. After rinsing the container, you can then fill the container with whatever water sample you want to analyze. Be sure to record when and where you took your sample.
The second step is to make some stock solutions that will be added to the water sample (for information of how to make a solution go here). The first stock solution is one of just a supporting electrolyte in deionized or distilled water. In the example data a 0.2 molar solution of potassium nitrate in deionized water was used.
The second solution is a known concentration of the metal to be analyzed (copper nitrate in the example data) in some of the supporting electrolyte solution mentioned above. This sample will be used to spike the unknown water sample. The concentration of the metal in this stock solution will need to be determined experimentally, and will depend on the concentration of the metal in the unknown water sample and the type of type of equipment you have available to measure accurate volumes. In the example data, an 8.2 mM solution of copper nitrate was used.
The next step is to make a series of samples to be analyzed with the ASV method. Each of the samples should have the same volume of unknown sample, same total volume, but with varying amount of electrolyte and metal-electrolyte solution. A table of the volumes of used of each solution for the example data is shown below.
After the solutions are made, connect the alligator clips of the WheeStat to the appropriate electrode (black-working, green-reference, and red-counter). In the exaple data a silver wire with heat shrink was used as the working electorde, a graphite rod was used as a counter electrode, and a silver/silver chloride reference electrode was used.
Next insert the electrodes into the solution with just the unknown water sample and supporting electrolyte.
Start the WheeStat software, select the COM port corresponding to the LaunchPad, click the "Connect" button.
Select the ASV experiment from the dropdown list.
Adjust the parameters (will need to be adjusted experimentally), and start the run.
After the voltamagram is finished, save the data, and repeat the steps for solutions two through four (or however many solutions you may have).
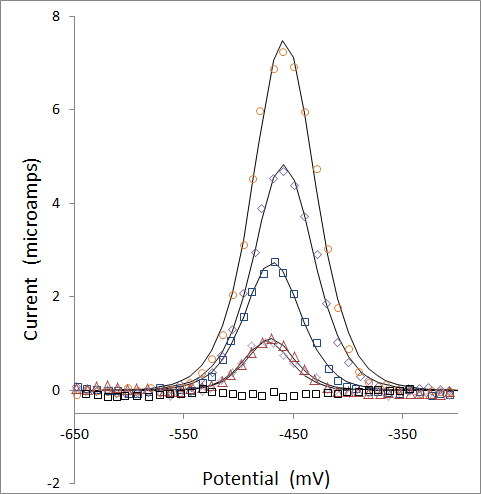
There should be a peak in the first voltammagram that grows in intensity as the concentration of added meatal increases.
The next step, after you have generated a voltammagam for each solution, is to find the areas of the peaks in the voltammagrams which correspond to the metal of interest. A GUI to do the integration will be available soon, but for now, integration can be done in excel. If there are no overlapping peaks with the peak for the metal of interest, then the trapezoid integration method can be used. If there are overlapping peaks the data can be fit to and equation using the Solver function in Excel (using equations 1 and 2 in this link).
Next is to graph the concentration of standard metal solution added versus the peak areas. This plot should be linear and look something like the example data below.
Once the data is plotted. Fit the graph with a linear line. From the slope and intercept of this line the X-intercept can be found. The absolute value of the X-intercept is the concentration of the metal of interest in the unknown sample.
In the example data above the X-intercept occurs at -0.27, since the x-axis is in mM, the concentration of copper in the sample with only the unknown water and electrolyte is 0.27 mM. Since the unknown water sample was diluted by a factor of two with the electrolyte solution, the actual concentration of copper in the unknown water sample is 0.54 mM.


