Purpose
This is a series of research notes documenting the basic setup and testing of the DF Robot series of liquid sensors. These sensors are designed for use wit the Arduino. This guide will walk you through the process of connecting the sensor to an Arduino, getting data from the sensor to your computer, and calibrating and making sense of the incoming data.
This series will not address any issues around logging data or deploying these sensors in the field. These issues should be addressed but this series is going to be about the basic process of connecting a sensor to an Arduino and seeing sensor-data on your computer screen.
While the different kinds of sensors in the series will have some different processes for setup and calibration, many of the steps will be the same for all of them. This page will be a general guide covering the process and aspects of setup that are common across all of the sensors. I will put specific guidelines on the use of individual sensors in separate research notes.
- Turbidity Sensor
- pH Sensor
- Electrical Conductivity Sensor
- Dissolved Oxygen Sensor
- ORP Meter
While this series is specific to the set of Arduino-based water quality sensors that I am currently investigating, a lot of the process is generalizable to other sensors and other microcontroller platforms.
Materials needed
- Your sensor of choice This is the sensor that you have picked to collect your data. Sensors covered in this series are:
- An Arduino Uno or Arduino Nano ($22.00 from Arduino, cheaper clone boards are available on Amazon (Uno, Nano), Ebay (Uno, Nano), and other resellers.
This is the microcontroller that we will be connecting our sensor to. The microcontroller will serve as the connection between our computer and the sensor. We will be programming the Arduino to take readings from our sensor and send them to our computer over a USB connection.
There are lots of different kinds of microcontrollers that you can use to get data from sensors. One of the important differences between these microcontrollers is whether they use 5 Volt or 3.3 Volt logic. Ideally you want to choose a microcontroller that uses the same voltage as your sensor for its logic.
The DFRobot sensors use 5V, as do the Arduino Uno+Nano. Many newer microcontrollers use 3.3V. While it is possible to use a 5V sensor with a 3.3V microcontroller (or vice versa), sometimes this will require more work or a more complicated circuit to make sure you are getting accurate data and not damaging your equipment.
These hook-up wires are designed to be easy to connect to a breadboard and to the sockets for making connections to the Arduino and the turbidity sensor board.
- Breadboard (if using the Arduino Nano)
While the Arduino Uno has a set of sockets that you can insert wires into in order to make connections to the board, the Arduino Nano has "header pin" connectors. We will use a small breadboard to make connections between our hook-up wires and these header pins.
This cable will connect your Arduino to your computer. We will use this connection to program the Arduino and to allow the Arduino to send data from our sensor back to our computer. If you are using an Arduino Nano you probably need a USB mini-b cable and if you are using an Uno you probably need a usb-b cable.
- A Computer
You will need a computer to power, program, and read data from the sensor.
The Arduino IDE that we will be using runs on Mac, Windows, and Linux. Chromebook users can use the Arduino Create app to program the Arduino but it has a small subscription fee.
It is possible to set up the circuit to be powered from its own power source and save its data to a separate storage device so you don't need to bring a computer to the field but I will not cover that in this guide.
If you are using one of the cheaper Arduino clones you will probably have to install special drivers to make them work. These drivers can be downloaded here.
Step 1: Testing Your Arduino
Before we do any work building the circuit for our sensor or writing code for the Arduino, we want to make sure that the Arduino works on its own and that we can connect to it using our computer.
To test the Arduino, we need to install the Arduino IDE software, connect the Arduino to our computer, and upload a simple test program to verify that everything is functioning. If we do this before we do any other work then we will know that we are starting with a functioning Arduino.
For more detail see: Setting Up and Testing an Arduino.
Step 2: Connect Sensor Probe to Circuit Board
All of the sensors that we are looking at in this series all share the same basic interface and design. They consist of:
- A Sensor Probe
- A Circuit Board
- Cabling to connect probe to board and board to Arduino
The probes all look different, and are used differently and they all have their own unique circuit boards that they plug into and cables and adapters to make this connection. For more information see the guides for specific sensors:
Step 3: Connect Sensor Circuit Board to Arduino
All of the sensors in this series have a common interface for connecting with an Arduino. It consists of a BLACK-RED-BLUE set of wires that plugs into the sensor circuit board and has a set of sockets on the other end.
We can plug hook-up wires into these sockets. These wires can be used to make connections between the Arduino and the sensor circuit board.
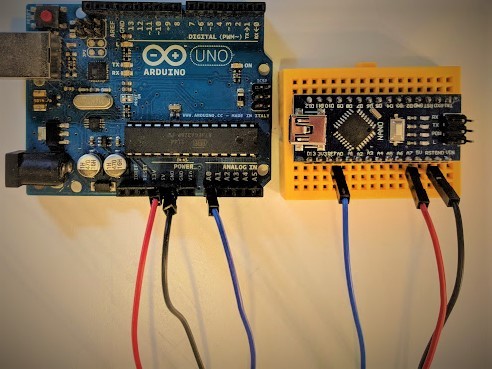
Both the Arduino UNO and the Arduino NANO have two sets of connectors on opposite sides of the board. All of these connectors are labelled with labels printed on the circuit board next to them.
On the Arduino UNO these connections are a series of sockets on the top of the board that you can plug wires into:
On the Arduino NANO they are a series of header-pins coming out of the bottom of the board that can be plugged into other sockets:
Both of these kinds of connection-points are called "_pins" _when we are talking about this kind of electronics. So we always talk about making connections between _pins _on the Arduino and _pins _on the other circuit boards that we're using, regardless of what physical form these connection-points takes.
Any sensor that you are using will have a datasheet or a guide that tells you how to wire it up. All of the DF Robot analog sensors share the same basic design.
There are 3 wires coming from the sensor circuit board that we need to connect to our Arduino. They are RED, BLACK, and BLUE. Each of these wires needs to be connected to a specific pin on the Arduino.
- The RED wire is for the POWER connection. It needs to be plugged into the pin labelled 5V.
- The BLACK wire is for the GROUND connection. It needs to plugged into one of the pins labelled GND.
- The BLUE wire is the DATA or SIGNAL connection. It needs to be plugged into one of the _Analog Input _pins on the Arduino. We will generally use the pin labelled A0 unless the sample code provided with the sensor uses a different pin.

The RED and BLACK (POWER and GROUND) wires connect the sensor to a power supply so that it has the electricity that it needs in order to run. The BLUE (SIGNAL) wire is the wire that sends an electrical signal from the sensor corresponding to the turbidity in the liquid.
Many sensors you use will follow this pattern of having a POWER, GROUND, and SIGNAL wire and will be wired up in much the same way. The main things you have to do differently for different sensors are:
- Make sure you have the right voltage (5 volts or 3.3 volts based on the sensor)
- Understand how to interpret the signal that you get from your sensor
Step 4: Upload and Test Code
Whenever you are working with an Arduino, your project will have two parts.
- A _hardware _portion where you build the circuit according to the specifications expected by your sensor
- A _software _portion where you program the Arduino to do all of the things that it needs to do to take readings from your sensor.
Without software, your Arduino doesn't know what to do with your sensor and won't take any readings at all. It will just keep running the "Blink" program that we used to test whether we could get it to work at all.
The coding that we do to make the sensor work is frequently very simple and usually the maker of your sensor will provide you with code that you can copy and paste to get started. You don't have to understand every aspect of this code in order to use it, but most example code that you find will have some comments written that explain how it works.
The most important thing we need to make sure of when we are using someone else's Arduino code is that their circuit is built the same way that ours is. In particular, if we have plugged our sensor into a certain pin (in our case, A0) we need to make sure that the code is written to get data from that same pin and change the code (or the circuit) if it isn't.
DF Robot has written sample code to go with all of their sensors. See the individual sensor activities for this code:
Because the sensors share the same interface, we can also test them all using the AnalogReadSerial example that comes with the Arduino IDE:
/*
  AnalogReadSerial

  Reads an analog input on pin 0, prints the result to the Serial Monitor.
  Graphical representation is available using Serial Plotter (Tools > Serial Plotter menu).
  Attach the center pin of a potentiometer to pin A0, and the outside pins to +5V and ground.

  This example code is in the public domain.

  http://www.arduino.cc/en/Tutorial/AnalogReadSerial
*/

// the setup routine runs once when you press reset:
void setup() {
  // initialize serial communication at 9600 bits per second:
  Serial.begin(9600);
}

// the loop routine runs over and over again forever:
void loop() {
  // read the input on analog pin 0:
  int sensorValue = analogRead(A0);
  // print out the value you read:
  Serial.println(sensorValue);
  delay(1);        // delay in between reads for stability
}
This code is pretty simple and each line of code has an accompanying comment (marked with a "//") describing what it does.
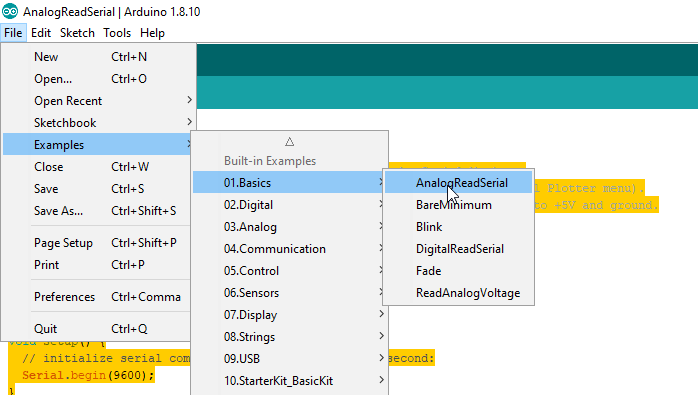
We can copy and paste this code into our Arduino IDE or just load it from the "File->Examples-01. Basics" menu.

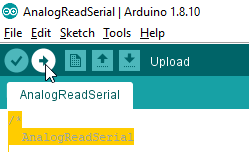
Once it is loaded you can upload it to the Arduino using the "Upload" button.

If everything is working, some lights should blink on the Arduino we should see an "Upload Successful" message at the bottom of the IDE.
If you don't, you can refer to the "Troubleshooting" steps in the Testing Your Arduino guide.
Step 5: Read Sensor Values Using Serial Monitor
Now that we've uploaded our code to the Arduino we want to check to see that we are getting data values back from our sensor and that these values make sense.
We can see the data being sent to our computer over the USB port using a tool in the Arduino software called the "Serial Monitor." You can access it through the "Tools" menu.
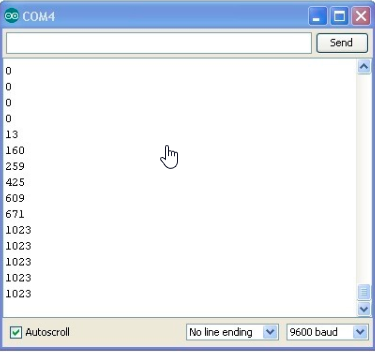
The data will come in over the Serial Monitor. If you use the basic AnalogReadSerial program you will see something like this:

With the numbers scrolling past very quickly (1000 times per second.)
These numbers will be between 0 and 1023. If you are testing your sensor you will want to just verify that they seem to change when the conditions that the sensor is sensing change.
For further information on how to make sense of these numbers, see one of the specific sensor guides:
or the documentation provided by your sensor's manufacturer.
Wrap up
This is a basic overview of how to connect this sensor series to an Arduino to verify that they are working and that you can get some data from them.
The next thing you will need to do is to calibrate your sensor. You will generally do this with a series of reference solution (i.e. liquids with known pH values.)
Because all of the sensors measure different parameters, and may have different behaviors under different conditions, this calibration process can be very different for different sensors.
Some sensors will give you different readings based on the temperature of the thing that you are measuring so you may need to control for temperature. Others might be particularly sensitive to movement or other kinds of noise.
Some sensors will have a linear relationship between the measured quantity and the sensor voltage output (so if you double the thing you are measuring, the number that the sensor sends to the Arduino will double) but some may have a different relationship.
Hopefully the manufacturer of your sensor can provide you enough guidance for you to get started. The best thing you can do, after looking at all of the documentation you can find, is to perform a bunch of experiments on known materials and try to make sense of the data you get back.
I will follow-up with a series on using and calibrating the DF Robot sensors described in this series. This note will link to those follow-ups as they are written.

1 Comments
Hello, this project is interesting to me. My day job is Environmental Geologist. We use water quality meters that measure 5 or 6 parameters. We use for groundwater sampling. Since there are 6 analog GPIOs on a Uno, can you hook up 6 senors are get readings from them? That would be interesting to see.
Is this a question? Click here to post it to the Questions page.
Reply to this comment...
Log in to comment
Login to comment.