I keep an eye on our web traffic at PublicLaboratory.org as a way to see how the community is growing -- it's obviously not the whole story but gives us a sense of the level of activity. And especially since our community grows quite a bit after major events or drives like the Kickstarters we've done, it's interesting to see the effects in terms of how many visitors we have.
After the spectrometry Kickstarter, we started having 4-5k visitors per week instead of the 2.5k average we'd had before. Some of this is because traffic is lower in the summer, but it now looks like we've been able to retain that level of activity! Even over the Thanksgiving holiday, we haven't dropped below 4100 visitors per week since the Kickstarter.
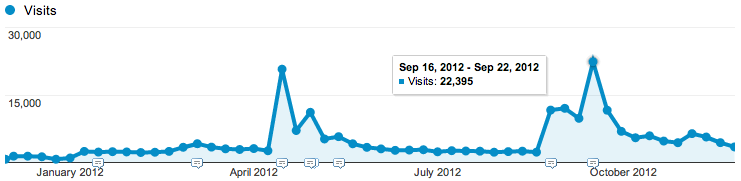
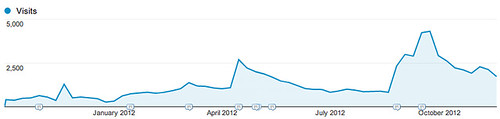
I also wanted to share the two graphs below, which show a) the # of returning visitors per week -- presumably people who are actually part of our community vs. b) new visitors (irrespective of whether they come back later and become a returning visitor) What's interesting is that while you see that returning visitors are not as affected by big traffic spikes (which are driven by things like the Occupy Oakland map, Google's map announcement, or the Kickstarter, for the 3 spikes below) we are definitely retaining quite a few people after each spike.
New visitors

Returning visitors
0 Comments
Login to comment.