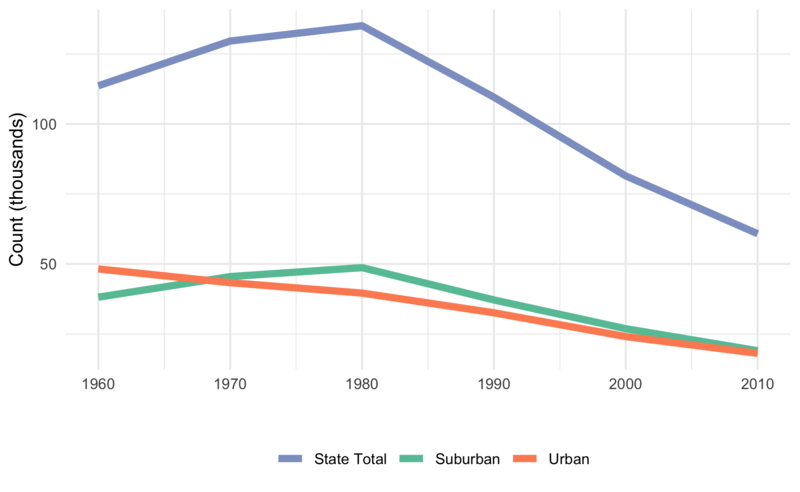
It is common to hear people describe Rhode Island as a "post-industrial" state. But what does that really mean? Researchers often study deindustrialization by measuring declining levels of manufacturing employment. This is an important measure because it tells us about the level of economic disinvestment the state has experienced. As the graph below indicates, net manufacturing job loss in Rhode Island began around 1980.
RI Manufacturing by Employment

Source: U.S. 2010: Longitudinal Tract Database
We can also measure deindustrialization by counting the opening and closing of manufacturing facilities. This place-based approach emphasizes how deindustrialization changes the built environment and impacts land-use decisions as old factories close and new ones open. Historical evidence from old industrial directories helps us see this process more clearly, providing strong evidence that deindustrialization in Rhode Island was a geographically uneven process.
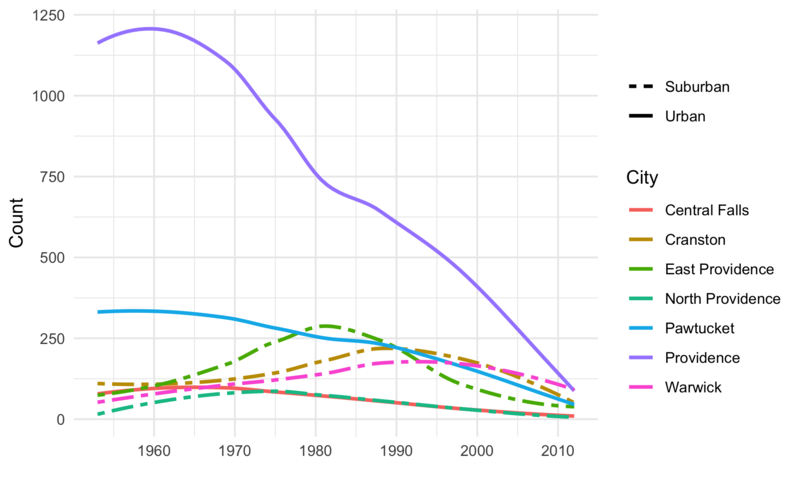
As the graph below indicates, deindustrialization hit Rhode Island's urban industrial core earliest and hardest. Providence experienced a steep decline in the number of active manufacturing facilities beginning around 1960. Central Falls and Pawtucket also saw steady declines in manufacturing beginning around the same time but at slower rates. In other words, factories were emptying out in these cities two decades before the state as a whole began registering net manufacturing job losses.
It is likely that many of those shuttered businesses relocated to the suburbs. In Cranston, manufacturing facility counts continued to increase into the 1980s. In East Providence and Warwick, the increase continued into the 1990s. Yet by the mid-1990s, manufacturing activities were leaving the suburbs, too. Today, only a few hundred manufacturing establishments are operating in the entire state.
The different patterns of factory closings suggest that deindustrialization is not one process, but many; its effects on communities and the built environment varies from place to place.
RI Manufacturing by Facility Counts

Source: Rhode Island Directory of Manufacturers
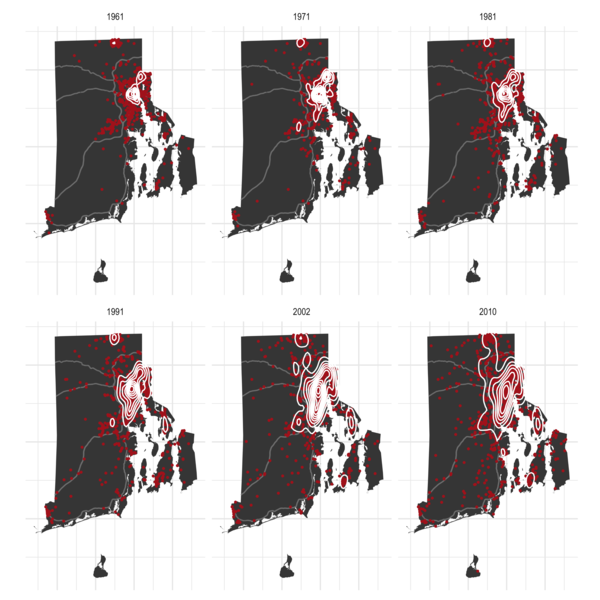
The maps below use the same data and provide another view of this shifting geography. The red dots on each map are manufacturing facilities operating in a given year. The white contour lines depict areas of spatial concentration. Together, the six maps provide a series of industrial activity "snapshots" and show us that as manufacturing facilities declined, they also spread out, becoming less concentrated but affecting more of the state.
De-concentration and Diffusion of RI Manufacturing, by Decade

Source: Rhode Island Directory of Manufacturers

0 Comments
Login to comment.