Hi all! best wishes for your safety and well being.
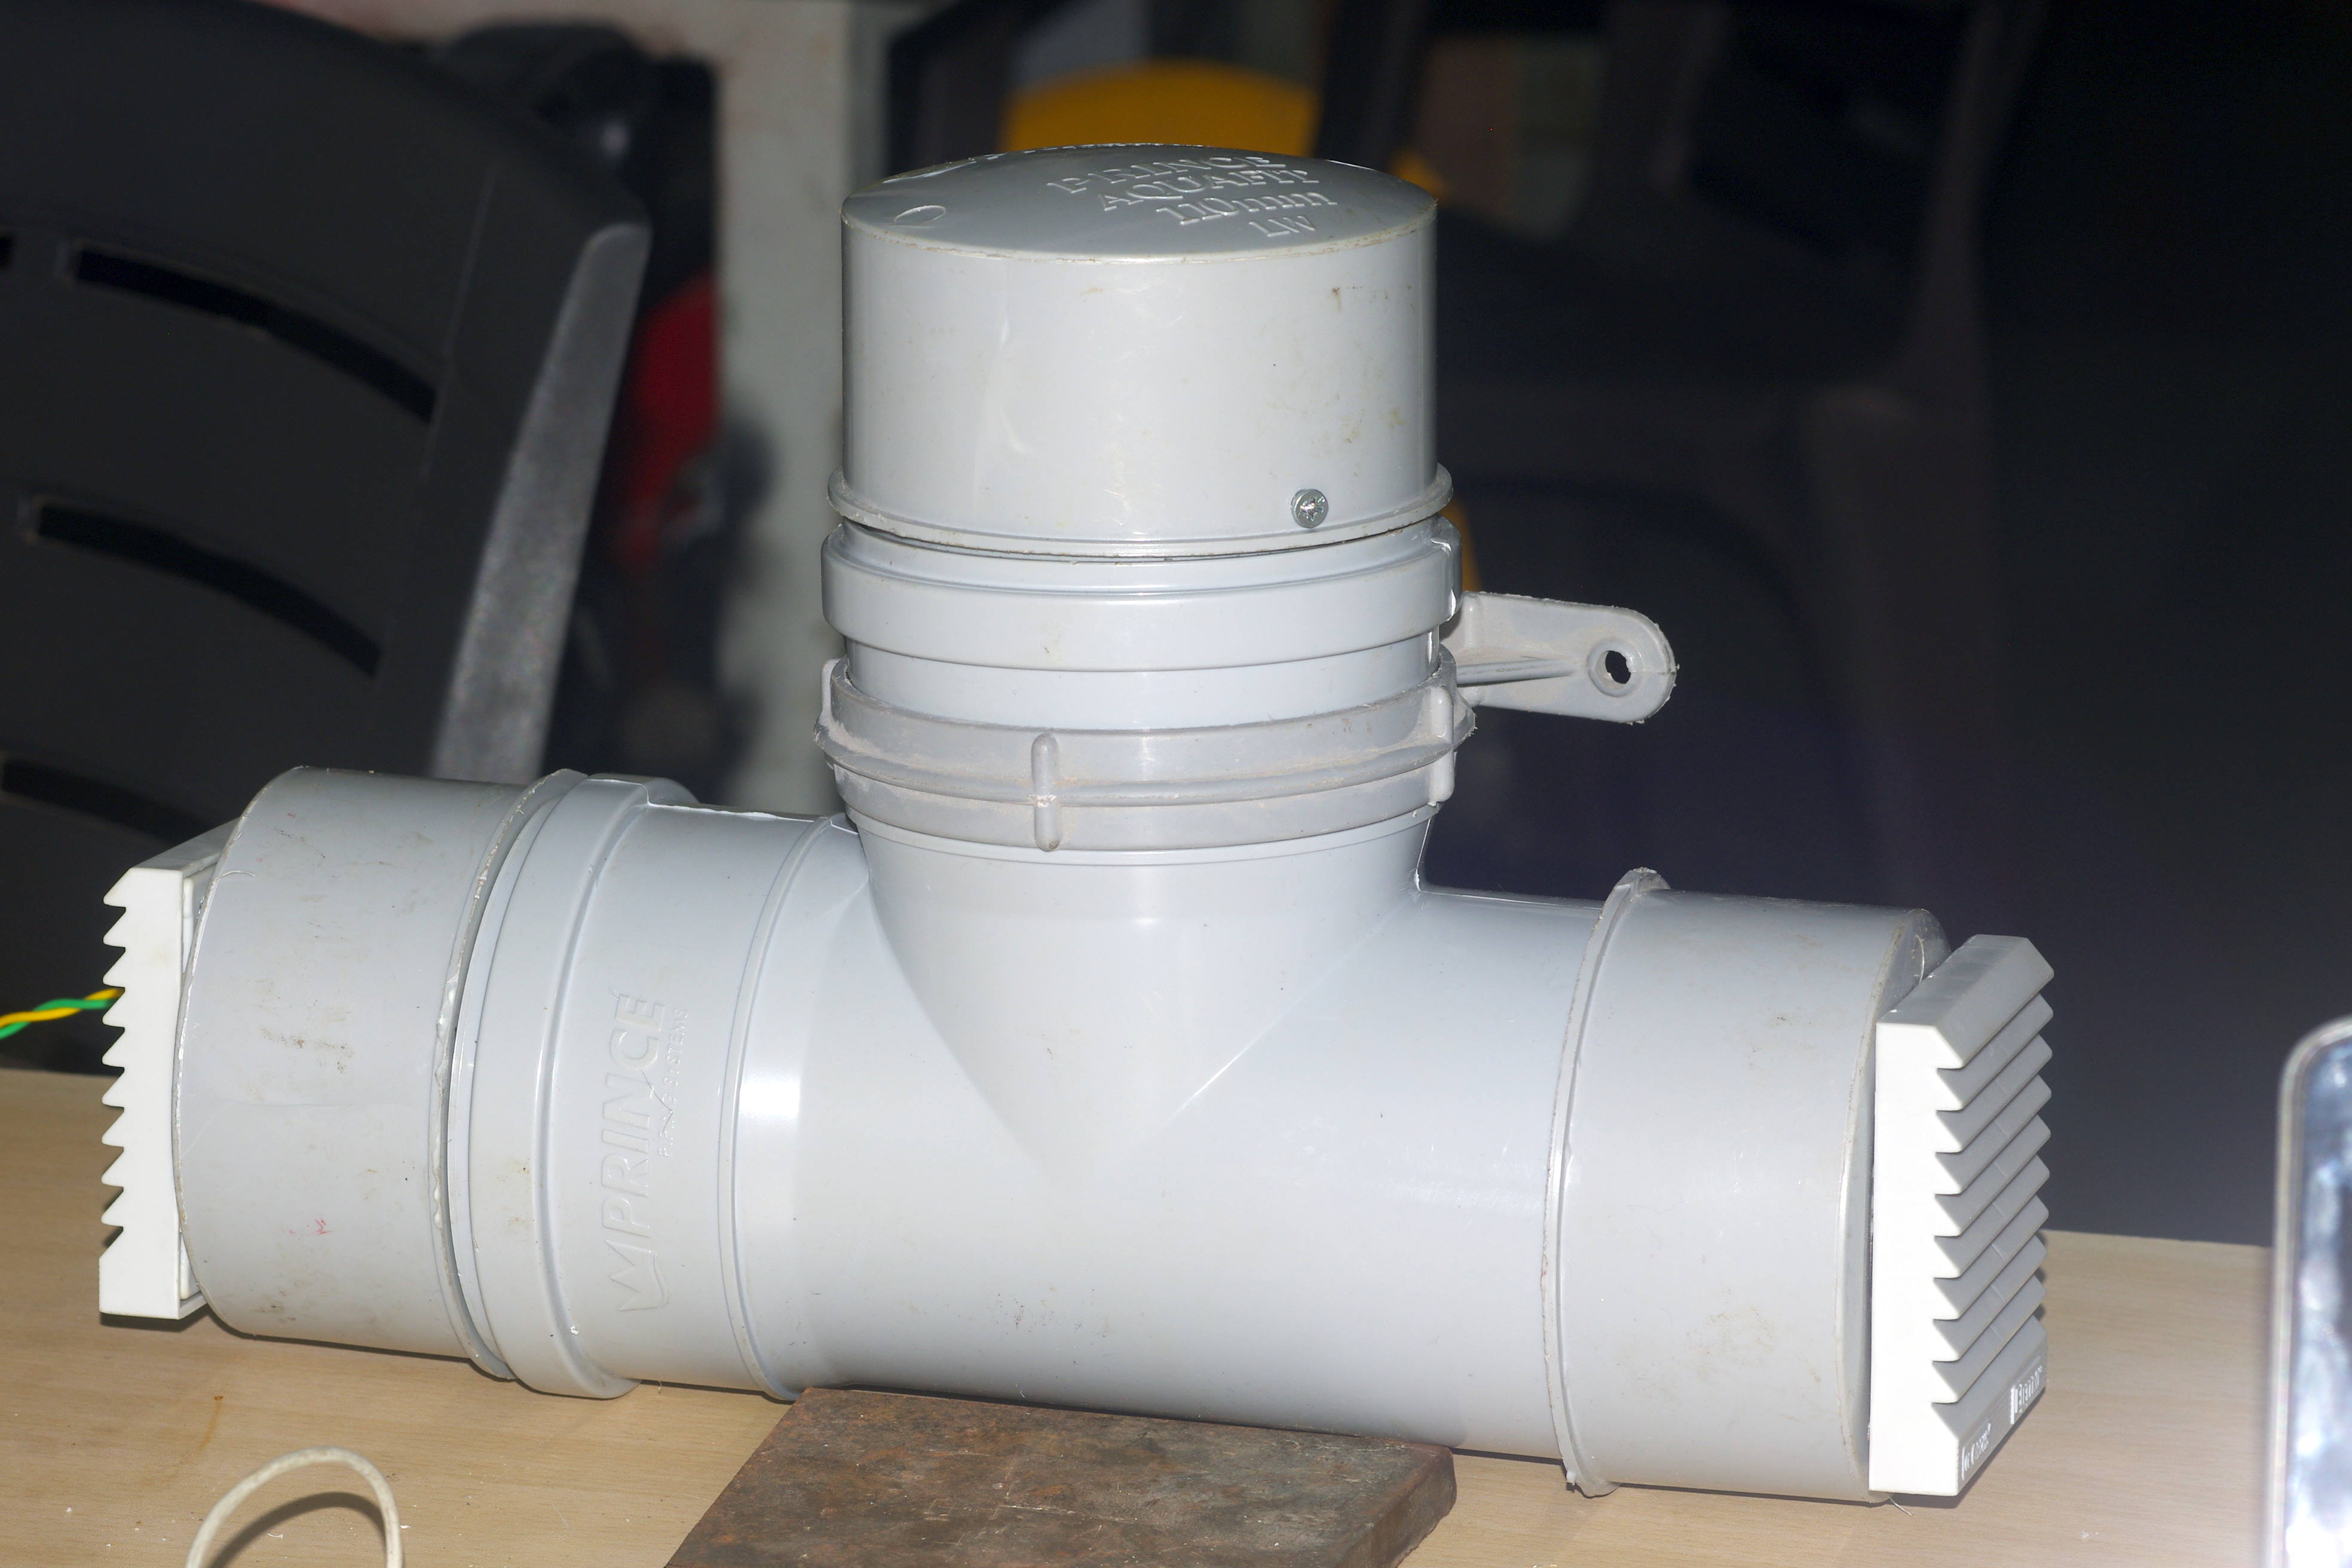
We are analyzing data from 5 or our open-source low-cost air pollution (PM) devices deployed across the city of Pune in western India. A detailed and regularly updated discussion is here.
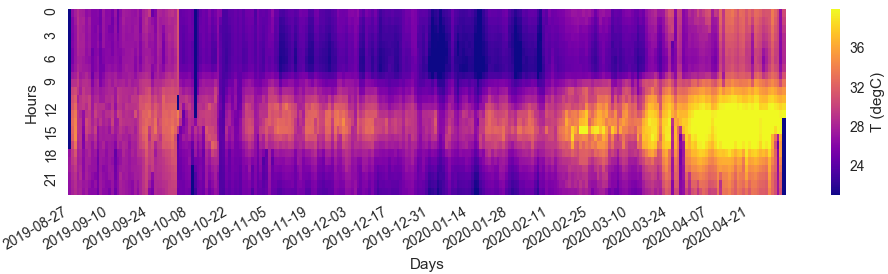
Each of these devices report an interesting common pattern of PM2.5 (and other PMs) across the days and hours of the day, as plotted in a heatmap example here. This device is located right next to a busy street crossing. And this heatmap is a 1 hour running average. I see a strong temperature correlation (heatmap #2).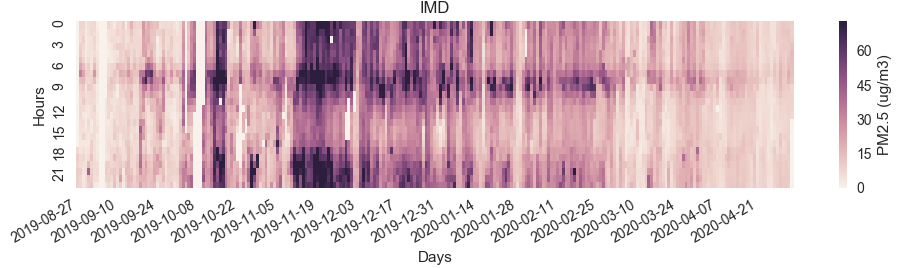
Observations:
- In the morning time-band from 6AM to 9AM, there is a general trend of high pollution, consistently throughout the days. Mostly due to colder temperatures and of-course home-to-work traffic.
- Pollution subsides post 12 noon and then rises again after 6PM! This could be explained by high convective winds due to the increased afternoon temperatures that carry and disperse air-pollution into upper atmospheric layers.
- 6PM+ pollution levels are due to the work-to-home traffic.
- Interestingly, post midnight, the pollution levels remain high despite no traffic. Again attributed to the low temperatures that condense the air and limit air-pollution vertical exchanges.
Question is, does any of you have such plots for your cities that you can share? I wonder if this is a typical tropical climate plot, since ours is one.
One quirk is that if this is the case, its best to venture out for clean air during hot afternoons!
thanks.
2 Comments
This is fascinating @Subir, i hope to build a device like yours and collect data to share from North Carolina, USA
Thanks @Liz ! I will be happy to share any details required for building it. Wouldn't it be wonderful to see pollution pattern at your place!
Reply to this comment...
Log in to comment
Login to comment.