I admit, just viewing a CFL spectrum with a webcam and a bit of cardboard was a kick but then the questions arise; what's real, what's noise, how good or bad is it and what can it measure. Like with all questions, the search for answers leads to more questions. With that in mind, I'll post some observations, some conjecture and more questions.
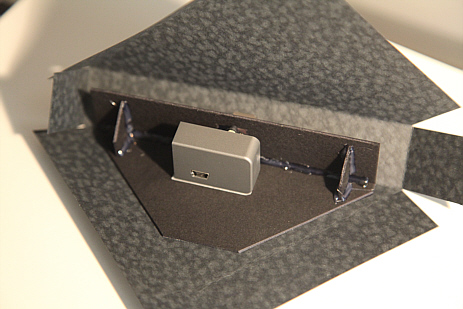
Step #1 Two mechanical issues have become clear. When experimenting with webcam spectrometers, it's helpful to have a light-tight enclosure with minimal internal reflections and it's necessary to still be able to make design changes. The title photo shows the partial assembly of a second proto sub-housing for the camera. The camera cover was removed and the DVD grating mounted as close to the lens as possible to maximize the pixels/nm ratio (which is still only about 1:1).
Step #2 The camera focus was set based on the lens rotation from end of travel (~5/8 turn CCW) which places the slit at about 6-inches and a baffle (internal reflection block) at about 1-1/2 inches out.
Protytpe Slit:

Prototype Baffle:

Step #3 For more flexibility with testing and measurements, an app was cobbled together to experiment with amplitude calibration and measurements:

As with 'SpectralWorkBench', viewing the RGB saturation is essential so as to avoid measurement corruption. It is also a convenient place to calculate a few signal parameters:

Note the display of calculated values for Signal, Noise and SNR. The Noise is taken as the RMS value for webcam response below 400nm which appears typical of the camera dark-field. The Signal has such variation that calculating RMS is questionable so a simple mean of the RGB peaks is used. As a result, the SNR is just an approximation but is reported in dB (log scale) which is easier to interpret. While the noise of 14.5 is a linear value of roughly 15 counts out of the webcams 8-bits and might seem small, the SNR of just over 6 dB is quite low and a clear indication of very small dynamic range. This is why it is so difficult to get the light intensity to a maximum, but unsaturated, level. Finally, notice the increased noise floor above 700nm. Some of this is logically IR from the lamp but I'm guessing that the energy further out may be swamped by noise -- maybe a "ghost reflection" of the spectra or general thermal noise. It's still an open issue to be resolved.
Step #4 The SpectralWorkBench app does well with calibrating to two spectral lines of a CFL so that method was adopted and appears to work sufficiently for now:

Step #5 Now that the pixel display has been calibrated for wavelength (the result of the CFL calibration process), the question is: Can the DVD phase grating + webcam (lens, Bayer filter & imaging system) be calibrated for measurement intensity over wavelength? I'm still not convinced, but here's my attempt.
Solux makes halogen lamps which have been modified to provide a light output which is more uniform over its useful wavelength. But more importantly, Solux publishes plots of their product's output. Using their 4700K lamp and published plot, data for their lamp was extracted (semi-automated) from the plot to use in this app.
Here's the assumption: If a known, relatively broadband, relative smooth-response light source is provided to the Spectrometer, and the intensity profile is extracted from the RGB spectrum, it should be possible to calculate a correction curve for the difference. That correction curve should tell the software what the system sensitivity vs spectral wavelength relationship is and therefore allow RELATIVE amplitude measurements. (Yes, this does assume amplitude linearity of the camera system and a few other things, but this seems a good place to start.)
Here's an example result. Notice that (Blue) is the ideal, published Solex data, (Green) is the measured data from the camera and (Black) is the calculated correction curve.

Step #6 Even though the webcam response to the Solux seems much further from ideal than I'd have expected, I couldn't resist taking a simple look at the potential for using such a calibration. This involves two parts: a) using this Solux calibration to correct a measurement of an experimental test setup and b) measuring the change which results from introducing some element to be measured -- in this case, water and food coloring.
A) An incandescent lamp was used for the light source. The resulting corrected curve validates the Solux calibration in a general way, as the curve does show the general trend toward max output in the 800-1000nm range. The large anomaly in the 550-650nm range correlates with a relatively weak Red-Channel signal from the webcam for the Solux lamp. The weak response means the SNR is extremely poor so any variance results in potentially huge errors in the correction curve from the calibration. Why the webcam response falls off this quickly at longer wavelengths is not yet understood.

B) Still, looking past these problems, the question becomes focused on differential measurements -- i.e., can small wavelength-related changes in light transmission through a test sample be measured. The test is a comparison with the reference being a water-filled narrow glass container illuminated with the incandescent lamp. Then, the sample is introduced; i.e, one drop of green food coloring -- nothing else is changed. While the results do show some of the expected results, they leave much to be desired from a measurement perspective.
There are two curves; the "flat reference curve" (with just glass and clear water) and the "dipped curve" (with food coloring added). Note that the 475-575nm band (green) shows little absorption -- as expected -- and "dips" on either side (475nm and 600-650m). The asymmetry is likely related to weak webcam sensitivity as reference before.

Other Observations:
Saturation: In all cases, care was taken to avoid RGB saturation so as to keep signals linear. This clearly showed the wide range in sensitivities of the webcam. Also clearly the RGGB Bayer filter arrangement has an effect, but with calibration this is less of an issue than dynamic range.
Dynamic range: Even when the enclosure is made relatively light-tight, there is still no more than about 10dB of dynamic range. This makes amplitude measurements difficult.
Noise: As a related observation, since most of the image field is dark, the camera (which has auto-exposure) appears to auto-adjust itself for maximum gain -- and thereby, maximum noise. So, while there is too much light from the typical source, that huge signal has to be reduced to prevent RGB saturation. This works against getting a better SNR, so the webcam exposure is working against better measurements where there is more then enough light. Noise levels above 15-20 "counts" should be suspect.
Questions:
1 - What might be done about the webcam's poor sensitivity curve? 2 - What options are available to set the webcam exposure? 3 - What options are there for controlling the light level to the webcam? [ Another research note is brewing for an inexpensive option.] 4 - What are the real numbers on amplitude measurement limits? 5 - Is there a better, flatter light source for amplitude calibration? 6 - What about reflectance measurements? -- they are likely much more difficult.
While I would not claim these measurements are sufficient to set my next prototype's direction, it is clear that there are sever challenged to be resolved before amplitude measurements (even relative amplitude measurements like absorption) can be performed with believable certainty (and calculated measurement uncertainty).
Cheers,
Dave
6 Comments
nice work Dave, very impressive. Some excellent diagrams and graphs.
I think that a lot of work that we might do with the spectroscope will be working with relative intensities, It is a huge task to get an absolute intensity reference that everyone can use, given the variety of lamps out there.
auto exposure is a pain !
In some recent work I did on absorbance and concentration, as you pointed out, my data were very noisy. I reckon I was seeing the CFL spectra underneath the halogen incandescent source despite pointing the 'scope directly at the halogen and away from the overhead flouros.
I've been searching for a BW cmos camera without much success. Mostly very expensive.
thanks for the excellent research note
stu
Reply to this comment...
Log in to comment
Hi, Dave - i'm very curious about the "app" you built - what was it in? Can you share it, or are you interested in open sourcing it? I'd love to try to duplicate some of the features in Spectral Workbench, if you found it to be very useful!
Is this a question? Click here to post it to the Questions page.
Reply to this comment...
Log in to comment
Stu, thanks. Yes, there's still much to be understood about the performance limitations.
Jeff, the app is in matlab though it could probably be constructed in scilab as well. It's very hard to design experiments w/o the option to develop measurement tools along the way. These are great environments for development but probably difficult for general consumption. However, I don't mind sharing concepts and techniques.
Reply to this comment...
Log in to comment
Dave, I bet quite a few folks in our community have Matlab, and it would be nice if they could replicate your experiments using your setup. Its ok to use files requiring proprietary programs.
Reply to this comment...
Log in to comment
the reason for the fast fallof at 600+ nm is IR filter on the CCD/CMOS chip of the camera. I am currently working on similar problem. I need to calibrate the spectrometer's sensitivity to different wavelengths for measurement of grow-lights. The problem with red and far red light cannot be solved by simple calculation, since the signal is either not present in this area or is deeply buried in noise. One option would be to use IR enabled security camera, but these are rather pricey for my pocket. For material analysis the different response of the sensor can be overcomed by covering 1/2 half of the entrance slit with your sample cuvette and the other half with reference cuvette. In this way you can measure relative absorbance at each wavelenght directly from one image. You only have to pay attention not to over saturate the sensor.
Reply to this comment...
Log in to comment
This is an old thread, and this has probably been resolved. However, Matlab has tools which enable which support conversion of Matlab code to C code, for improved speed of execution. This may help with implementation/generalization from Matlab (which costs thousands of dollars per license) to a subroutine under Spectral Workbench.
Reply to this comment...
Log in to comment
Login to comment.