After a month of stormwater monitoring and collecting data, we got together for one more workshop to talk about the monitoring that we have done and the lessons we all had learned. (Read more about the Stormwater Workshop series here with posts from all the other events).
How we monitored
The way we structed the monitoring was set up in Workshop 4. On June 14th a group of about 20 of us got together to run through a dry run of monitoring each site together. Then once that was all set up, the Green Team took over monitoring all three sites for about three weeks. We collected all the data on this wiki which included step by steps for each type of monitoring we were doing.
Observations
Since we were exploring several different types of monitoring methods, we learned the most about different type of monitoring, and secondly about the sites themselves.
Site Surveys
We made and used this form for collecting information on each site every day we monitored (Monday-Friday for three weeks). This site survey included capturing information about how much water was in the rain gauges, the depth of the water at the site using gauge boards, and taking ground photos and observations on the app I See Change.

I See Change posts from the Green Team
Advantages:
There were a number of advantages of using the site surveys to collect data:
- We found the site surveys helped us develop a narrative about each location over time. By the end of the three weeks, we had a pretty good idea about what was going on at each site.
- We were able to observe not only the stormwater as it changed with weather and time, but also how pedestrians, vehicles, and cyclists reacted to it.
- We were able to share out earlier and more often with the site survey data, and engage other people in what we were seeing because we posted about it online.

Challenges:
Some of the challenges we encountered included:
- We did not have a set place to take photos from. This meant that each of our ground photos changed a bit over time. This produced new and interesting data, but made consistency harder to capture.
- We did not having a set place to put the gauge board. This meant that the data collected on water depth was a little different each time as well. We explored this idea further as we thought about next ideas and steps (outlined below).
- We only collected the site surveys on weekdays which made our rain gauge information inconsistent on Mondays where we had data over the weekend, versus the rest of the week where we had daily rain data.
- It was harder to collect the data on inclement weather days.
- It required us to be there in person each day which was demanding over time.

Time-Lapse Cameras
At two of the sites we set up time-lapse cameras to capture hourly photos of where we thought stormwater was accumulating.


Advantages:
- The time-lapse photos of the Villere site told us a lot about what was happening at the site over time.
- Where we had thought the puddle was there all the time during our site surveys, the time-lapse photos showed that this wasn't always the case.
- The photos were always taken from the same vantage point and the consistency of this helped us observe changes more easily.
- The camera batteries lasted a long time and we didn't have any trouble with people tampering with the camera.
- We were able to see how long it was taking for the puddle to grow or disappear over time which was one of our original research questions and exciting to discover.
Challenges:
- We struggled with the settings of the Earth Lab camera. It wasn't set correctly and we didn't end up capturing a lot of images from it. We figured out how to fix it and posted this method of "how to get the camera into time-lapse mode" up on Public Lab.
- There was a truck that parked in the way of our Villere street camera many of the days it was out there which made observations of the site challenging.
- Looking back at the Villere street photos, I'm wondering if the motion sensor for the photos was on because of how many cars/people/cyclists we caught.
 The black van that ended up in the way of a lot of our photos for the second part of the month.
Other lessons learned
- We attempted to use the plopper to measure the amount of water in the underground storage tank at the Earth Lab site. The students had a hard time working this method.
- We realized that while we were able to capture the amount of rain that had fallen in our rain gauges, we were not able to capture the rain intensity. This is something we're still thinking about.
- Our puddles changed over time. They did not always form the same way after each rain event.
- We had two rain gauges up on this project, they were only a few blocks apart, but they often had surprisingly different amounts of water in them (see our data on the wiki).
Ideas moving forward:
We learned a lot over this workshop series. Of the methods of collecting data we tested out, some were good at answering some questions, while others were good at other things. Some ideas and other research questions we had after looking at our results were:
- We could draw the puddles on the road to create a more visual space for people to interact with the project and perhaps help us understand more about the puddles changing over time.
- Measure the puddle depths in different place with the gauge board so we would know the volume of the puddle.
- Start exploring a transect of one of the streets with different data points along it so we have a more holistic understanding of the street system.
- Graph the rain data from weather underground and post it with our time-lapse images as graphs or as annotated videos.
- Figure out more ways to put the data together.
Specifically for this project we're interested in exploring some other questions and projects if the time and opportunities arise. Those include:
- Interviewing people along the Villere site and explore their experiences with stormwater.
- Sharing our Villere street data with residents and with the site architects who will be working on the HUD project.
- Run a transect project exploring the Villere street site further.
- See if we can figure out how much stormwater is falling on the Healing Center roof and captured by the underground storage tanks.
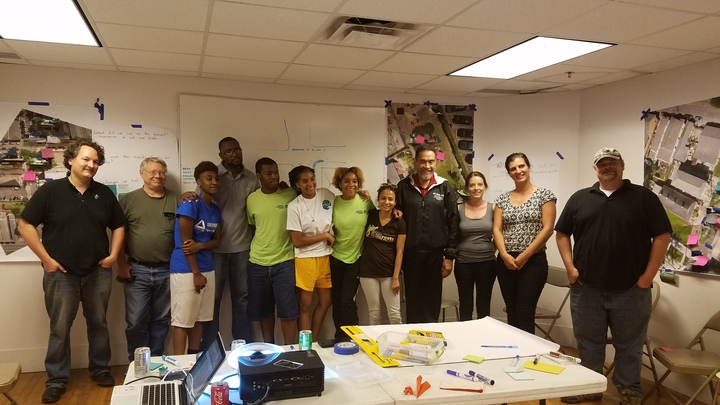
We really enjoyed this project and celebrated our last workshop with a pizza party! Thanks to partners and supporters of the project. Last we'd like to encourage others to explore stormwater, try out some of these methods or test your own. The more we explore, the more we learn.
0 Comments
Login to comment.