Hi all ! This post is continued from https://publiclab.org/notes/sagarpreet/06-06-2018/leaflet-environmental-layer-library and explains various more layers added to the library .
Summary of the library :
This library is a made upon the very popular LeafletJS Library and using this we can choose combinations of layers to display on map . Each layers gives some environment - related information on map in form of small markers . Each marker on clicking shows pop-up with detailed information .
The demo of this library is : https://publiclab.github.io/leaflet-environmental-layers/example/mapSimple.html
**The Github link to code repository is **: https://github.com/publiclab/leaflet-environmental-layers
Layers list we can choose :
1.) PurpleAir Layer :
An air quality monitoring network built on a new generation of "Internet of Things" sensors.
A proven air quality monitoring solution for home enthusiasts and air quality professionals alike.
Using a new generation of laser particle counters to provide real time measurement of (amongst other data), PM1.0, PM2.5 and PM10. PurpleAir sensors are easy to install, requiring a power outlet and WiFi. They use WiFi to report in real time to the PurpleAir Map.
More details : https://www.purpleair.com/
Heat-Map :
Detailed - layer :
2.) FracTracker Layer :
FracTracker Alliance studies, maps, and communicates the risks of oil and gas development to protect our planet and support the renewable energy transformation.
FracTracker is a leading resource on oil and gas issues and a trusted asset to the concerned public.
More information can be found here : https://www.fractracker.org/about-us/
3.) MapKnitter Layer :
Balloon mapping is a low-cost way to take aerial photos using a camera, attached to a balloon, on a spool of string. People have done this from a few hundred feet up all the way to over 4,000 feet in the air.
For more information visit : https://mapknitter.org/
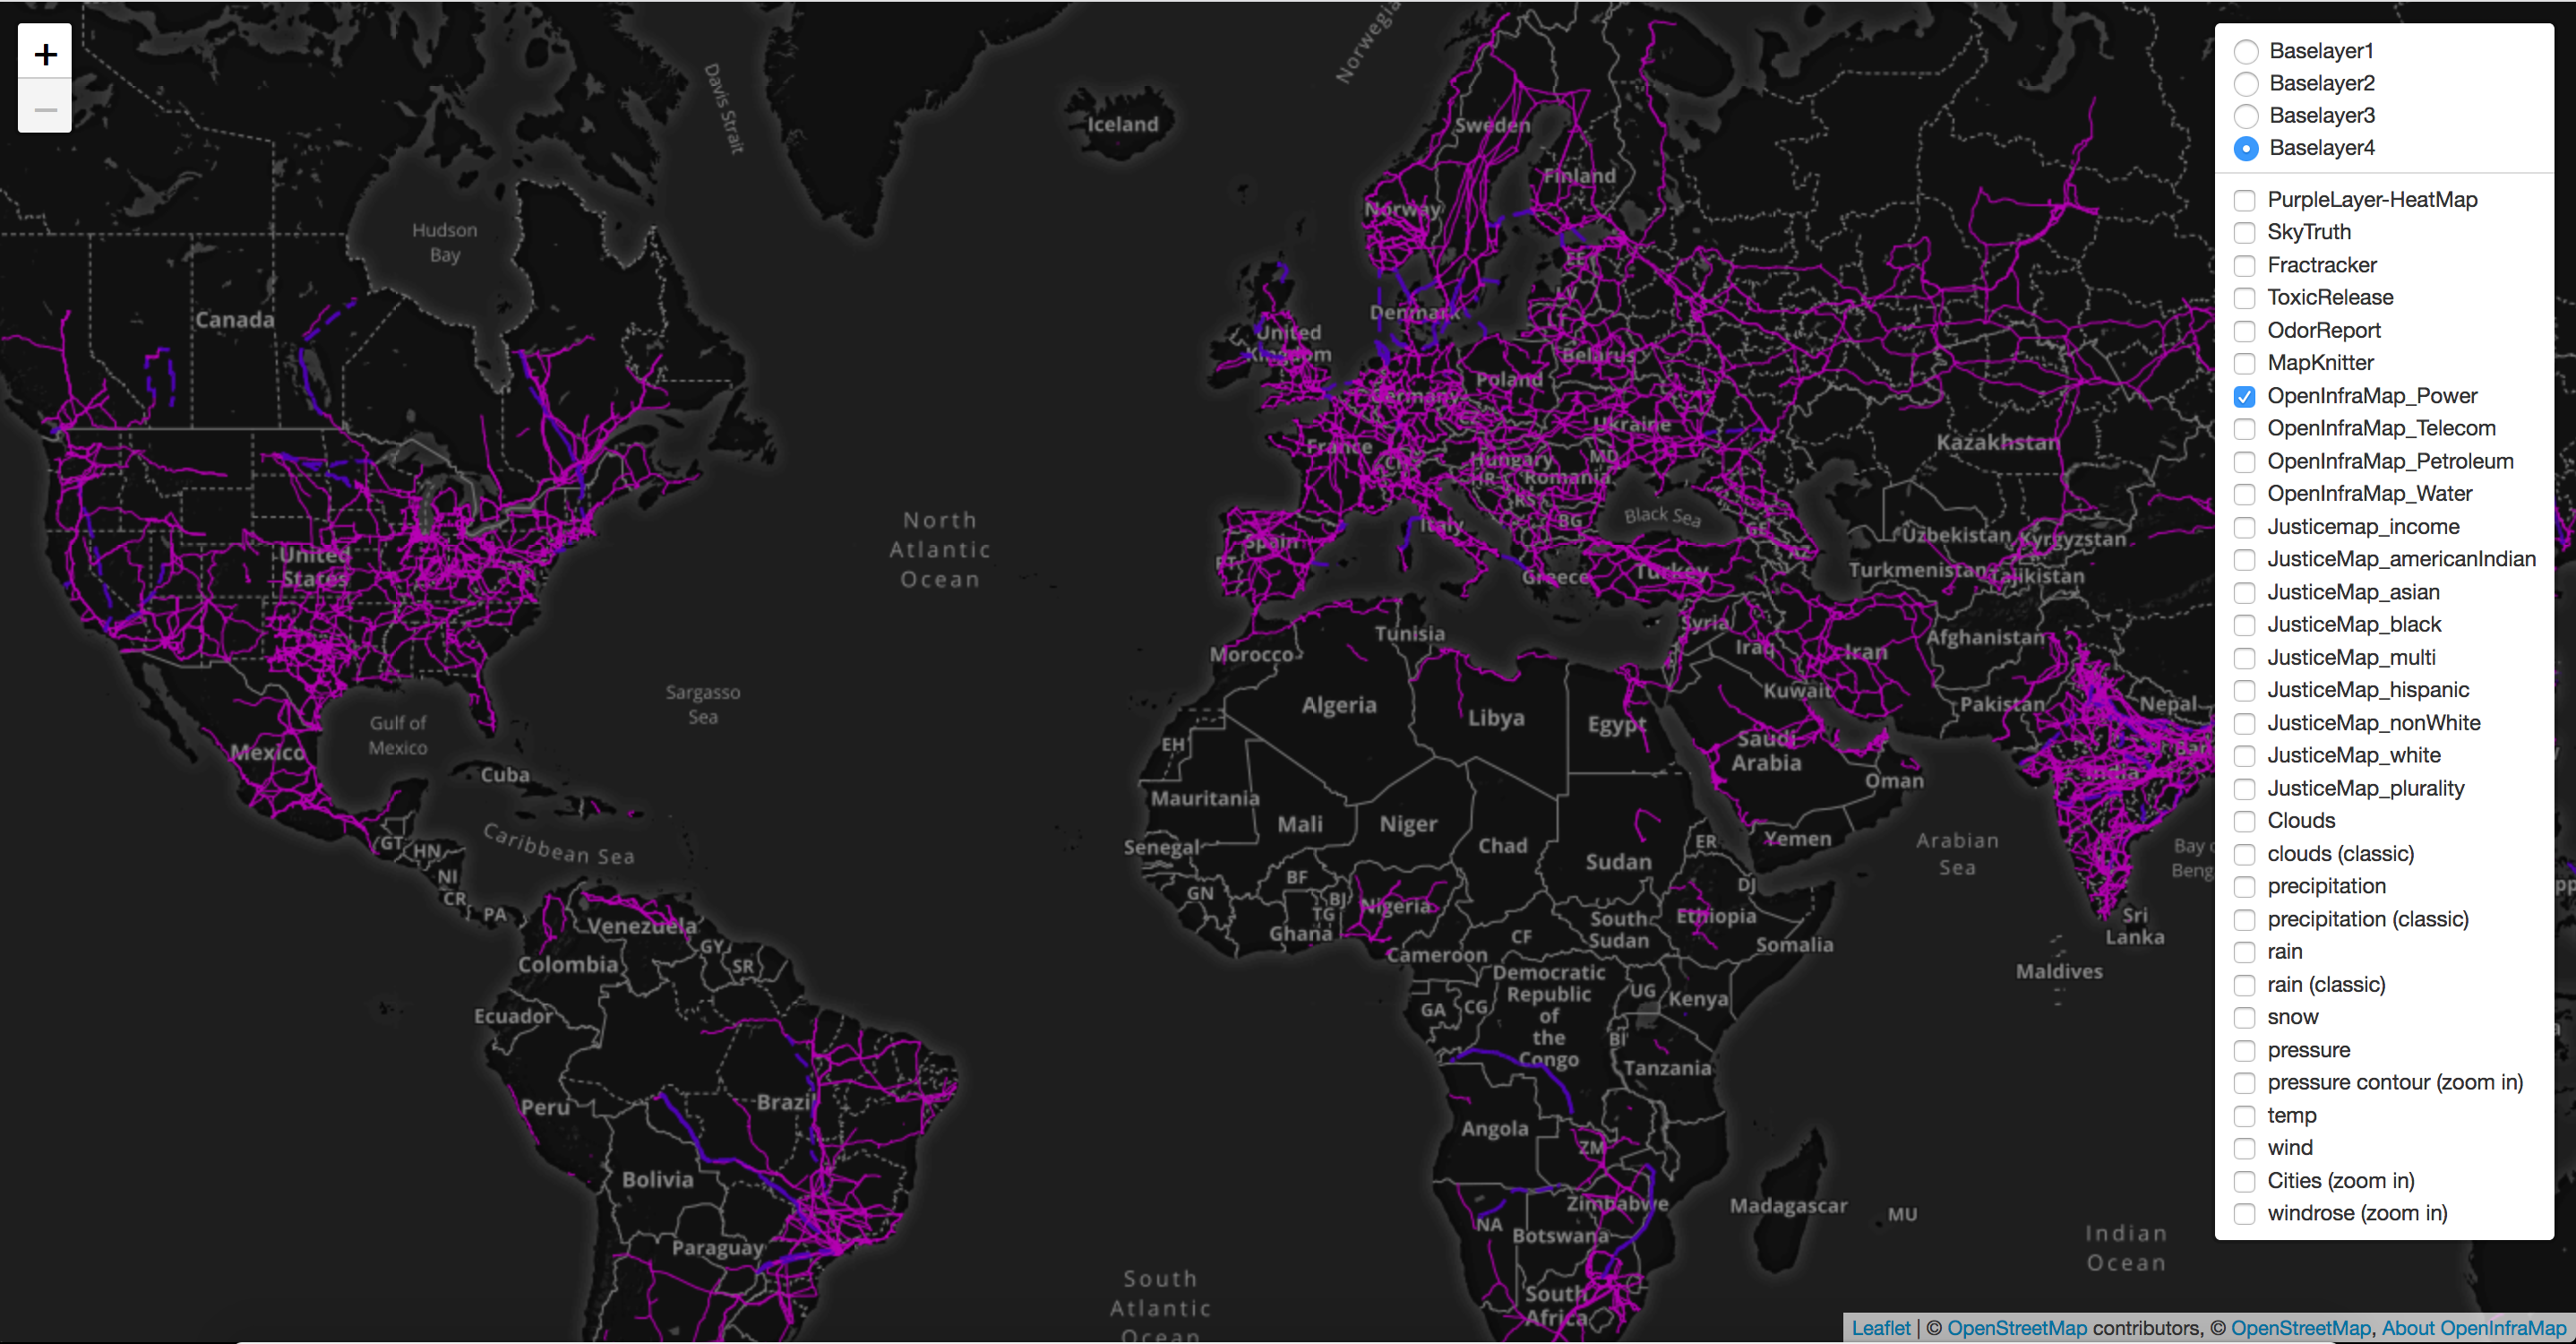
4.) OpenInfra-Map Layers :
Open Infrastructure Map is a view of the world's hidden infrastructure mapped in the OpenStreetMap database.
More information can be found here : https://openinframap.org/about.html
a.) Telecom layer :
b.) Water layer :
c.) Power layer :
About Project :
This project is created as a part of Google Summer of Code program by Sagarpreet Chadha .
Mentors for this project :
• Stevie Lewis
• jywarren
• Bronwen Densmore
If you have any suggestions or any doubts regarding the use of this library , kindly open an issue here .
8 Comments
Hi! Great post! I had trouble with this link: https://publiclab.github.io/leaflet-environmental-layers Can you check it for me?
Is this a question? Click here to post it to the Questions page.
Reply to this comment...
Log in to comment
Hi ! Thanks . Updated the link 😄 .
Reply to this comment...
Log in to comment
Looks great! Could the layers also have a pop-out that explain what they are, where they are from and where people can learn more when you click on them?
Is this a question? Click here to post it to the Questions page.
Reply to this comment...
Log in to comment
@xose @imvec @sarasage - I'm really interested in how these layers can help inform and support local environmental projects. I noticed that if you zoom into Val Verde, where @sarasage and others are working, the wind direction is helpful but not that great -- you have to zoom out a bit to see a nearby weather station.
I'm wondering two things --
https://mapknitter.org/#13/34.4386/-118.6630
Is this a question? Click here to post it to the Questions page.
Reply to this comment...
Log in to comment
The landfill is shown on OpenStreetMap! https://osm.org/go/TYrX7hdN-
Reply to this comment...
Log in to comment
I found that there is a
landuse=landfilltag, from https://wiki.openstreetmap.org/wiki/Map_FeaturesUsing that, I made a query on this page: http://harrywood.co.uk/maps/uixapi/xapi.html
http://www.overpass-api.de/api/xapi?*[landuse=landfill][bbox=-118.66693,34.41951,-118.57801,34.46906]
Note this can only be used for very zoomed-in areas, so not for a view of a whole continent or country.
It shows this output in XML: https://gist.github.com/jywarren/5c0251c0ea3e4c38933bbf0a0d12fc7f
Including:
    <tag k="name" v="Chiquita Canyon Landfill"/>
    <tag k="operator" v="Waste Connections Inc"/>
Looking for how this could be gotten in JSON; docs here: http://www.overpass-api.de/output_formats.html#json
And it works! See:
https://www.overpass-api.de/api/interpreter?data=[out:json];waylanduse=landfill;out%20meta;
It's a polygon, the outline of the landfill.
@sagarpreet, could we use this as an additional layer?
Is this a question? Click here to post it to the Questions page.
Reply to this comment...
Log in to comment
@liz - you know some OpenStreetMap folks, do you know if this is an OK use of the API in terms of how often we'd query?
Is this a question? Click here to post it to the Questions page.
Reply to this comment...
Log in to comment
Linking back to issue I made from this: https://github.com/publiclab/leaflet-environmental-layers/issues/50
Reply to this comment...
Log in to comment
Login to comment.