Girl Scout Troop 5399 is going on a journey to learn about air. All aspects of air. To learn more about air, we decided to deploy a dust particle sensor - the Shinyei PPD42S - in downtown Brooklyn. All of the code, data and report can be found here on github.
Our Methodology
To measure air quality in Downtown Brooklyn, we decided to take readings throughout the Metrotech area using the Shinyei Dust particle sensor. The scouts formed two groups and choose four different locations. At each location, the scouts documented the location and the time they stayed in the location as well as other miscellaneous information about the area (ie a park, there are cars, people smoking etc..). They recorded data for 5 minutes at each location before moving on to the next location.
Here is a map of the eight locations visited between the two groups.

Deployment
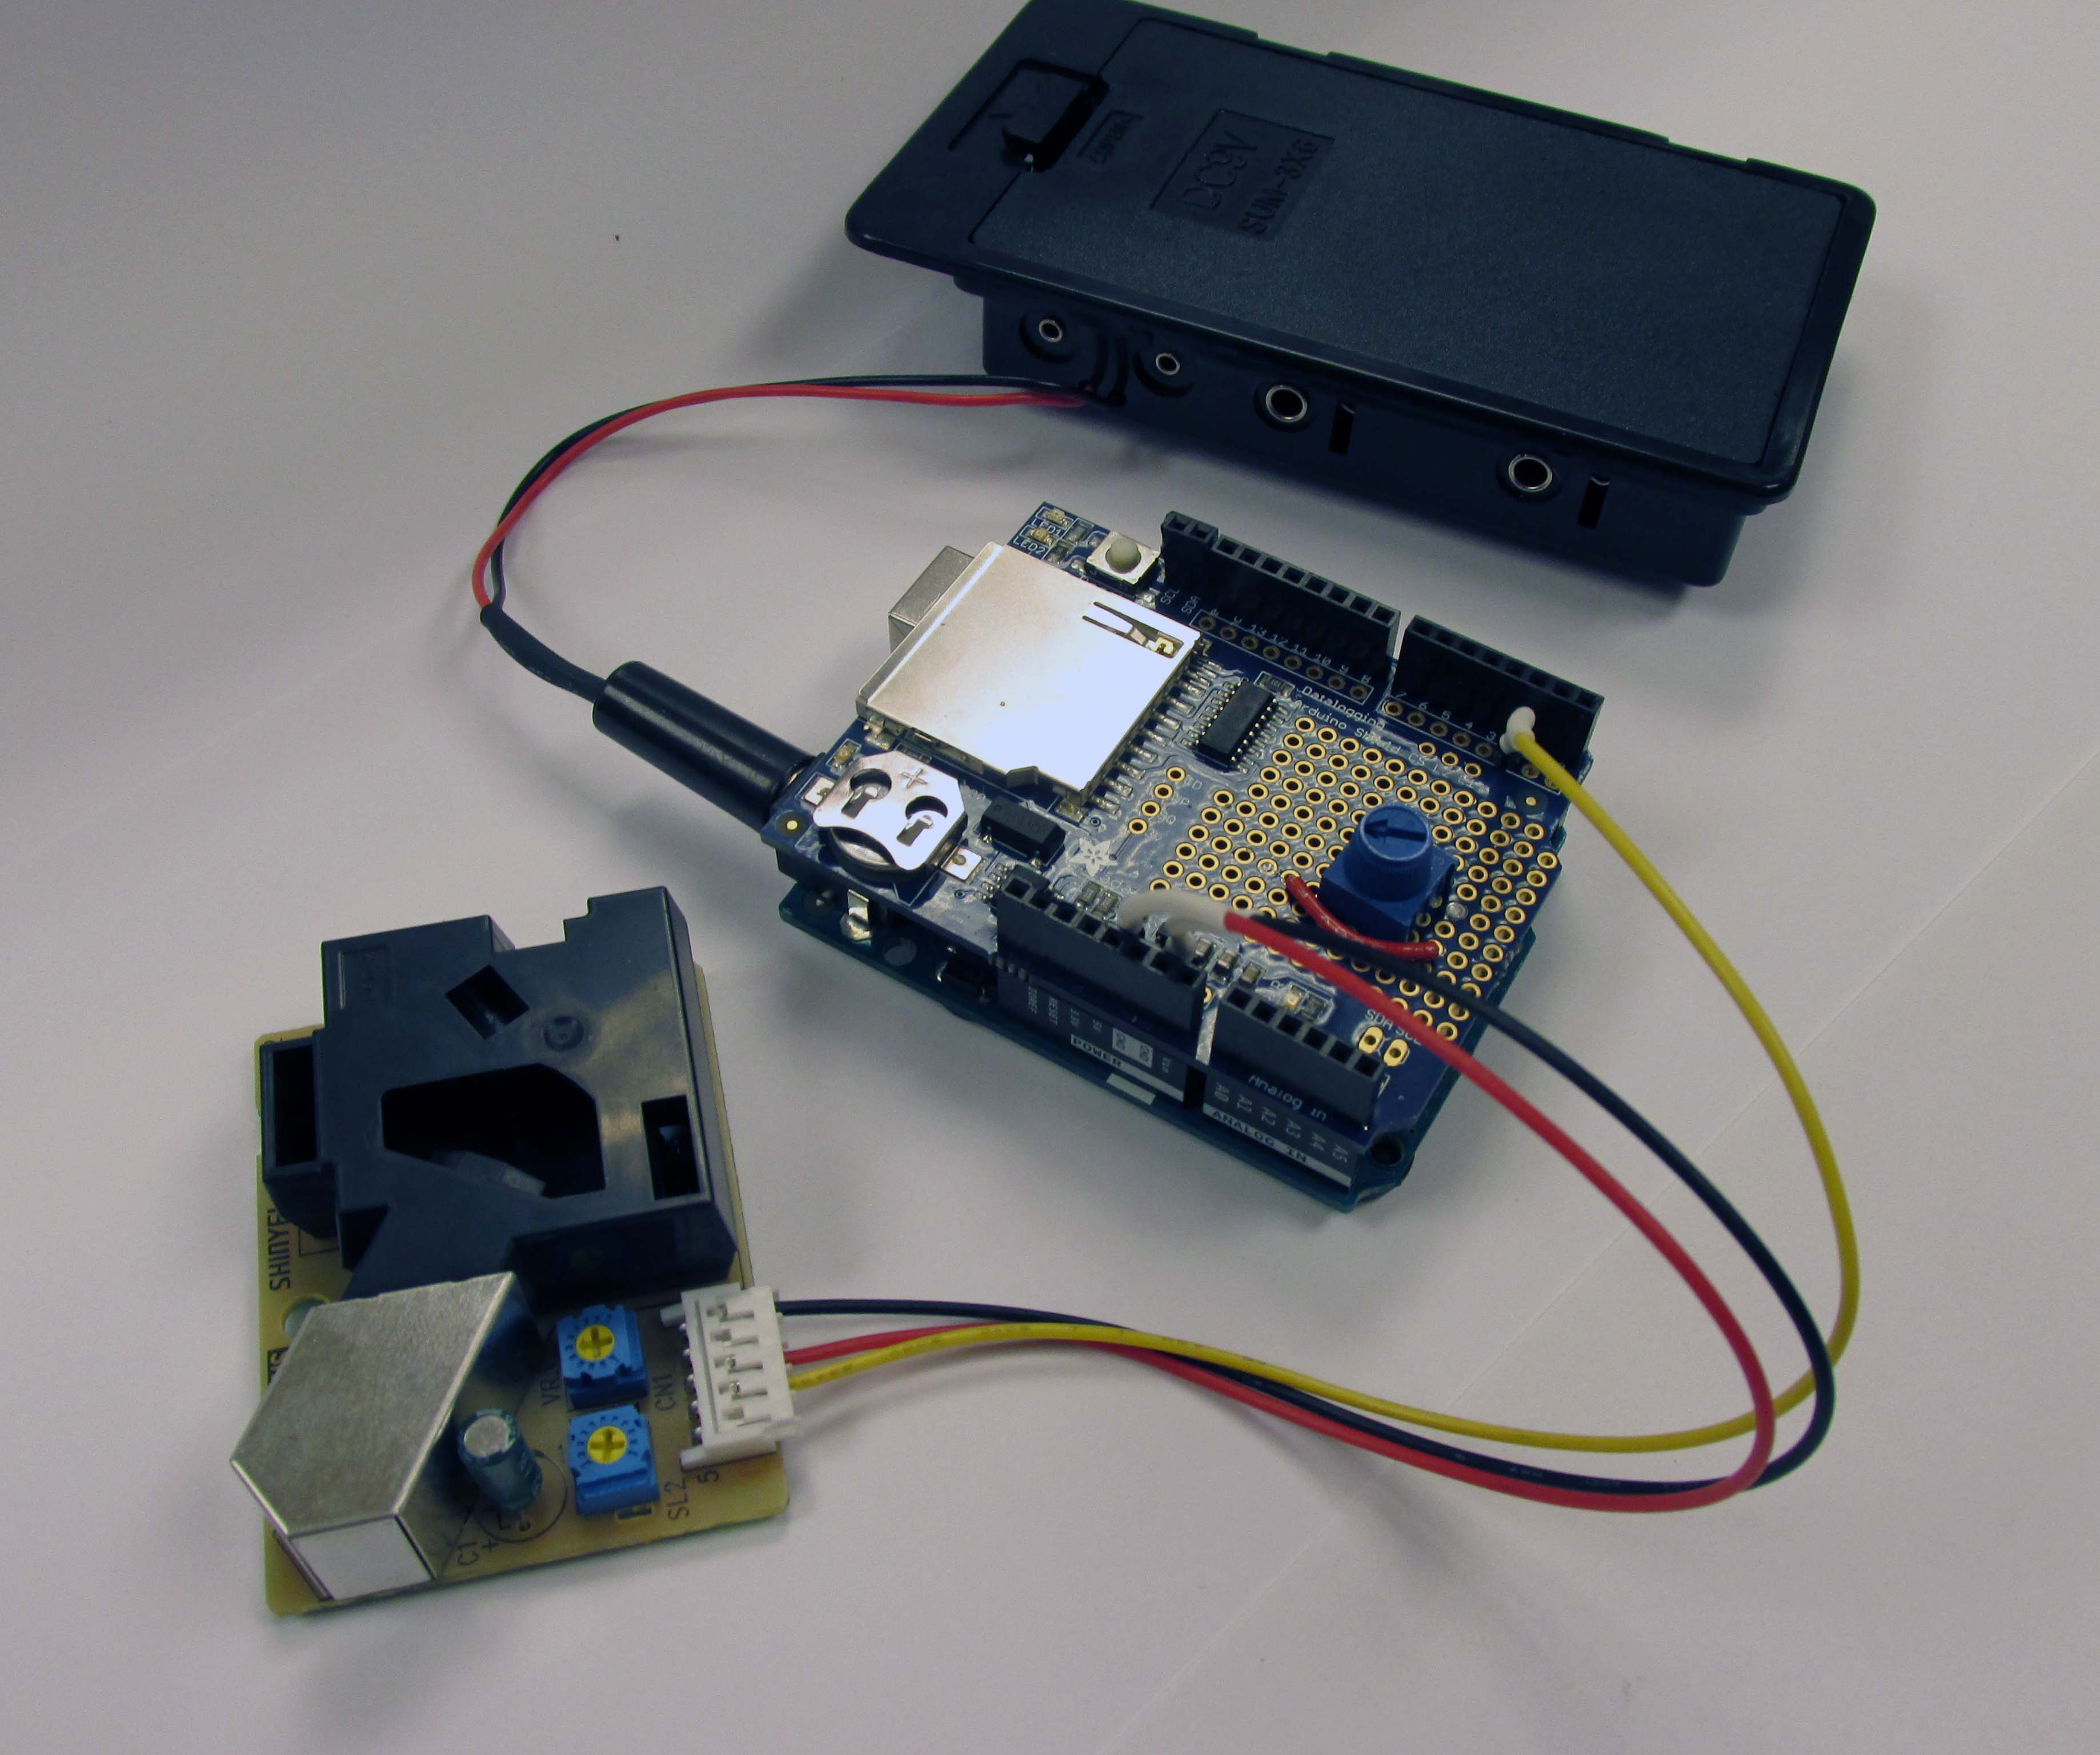
The Shinyei is a low cost dust particle sensor which many is being used in many air quality projects such as Dustduino. For this experiment, we used an Arduino and the Adafruit Data Loggin shield which allows us to write to an SD card. The device was made mobile by a battery pack.

The code is the standard code which can be found in many places. One issue we had with the code is that the real-time clock did not properly write to the data file. I'm unsure what happened and didnt have time beforehand to debug.
Our Results
The plots below were generated from data collected using a python script(found in github repo). In the first plot, generated by Group 1 data, there are peaks around 10:40am which correspond to collection point number 4. This site is a tunnel under two Metrotech in which there we several trucks unloading material. The first 30-40min collection period was taken from collection points 1-3 in which most of the environment was open and park-like.

The second plot, generated by Group 2, also shows a tremendous spike around 10:40am when the group was taking measurements at location 4. This location is the intersection of Flatbush and Tillary Street. The time period from 10:25-10:35 also shows high concentrations of particles which was taken at location 3 adjacent to a construction site while location 2 was inside the Metrotech commons.

Next Steps
The group would like to explore other locations such as rivers, other intersections and subway stations to compare results. Similarly, the scouts noted they should have documented more of the environment while they were taking the readings.
3 Comments
Girl Scouts are the best!
Reply to this comment...
Log in to comment
Real neat!
two comments about the setup: the shinyei should have everything but the intake and outlet covered to prevent light leakage.
you may want to average measurements over a longer timescale than the 30 seconds recommended by Shinyei. this post on India Air Quality details some of the issues of smoothing the sensors' noise out. http://indiaairquality.com/2014/12/14/measuring-the-pickle-jr-a-modified-ppd42-with-an-attached-fan/
Reply to this comment...
Log in to comment
@mathew Thanks! I had meant to 3D print a container for the Shinyei but didnt have time. I've seen some people have good success by incorporating a fan...if anyone has a 3D model for the shinyei and/or have experience attaching a fan I would love to see it.
And thanks for the idea about longer measurement time periods. I'll be interested to see the results....
And these scouts were AWESOME!! They were full of ideas for next steps and variations of testing that we'll try and do next time...
Reply to this comment...
Log in to comment
Login to comment.