I've continued to experiment with my prototyping rig. I've learned that newer versions of the Arduino application are command-line aware! So you can simply point it at your sketches to compile and upload them. You can also direct it to download and install the board descriptions of other boards. For the moment, I'm continuing to use arduino.mk.
For testing, I connected a thermometer (TM37) and light sensor (LM393) to my arduino and put together the following sketch to record values via analog inputs and output CSV values via the serial monitor.
void setup() {
  Serial.begin(9600);
}

void loop() {
  unsigned int Light;
  unsigned int TempReading;
  Light = analogRead(A0);
  TempReading = analogRead(A1);
  float Voltage = TempReading * 5.0;
  Voltage /= 1024.0;
  float TempC = (Voltage - 0.5) * 100 ;
  Serial.print(Light);
  Serial.print(",");
  Serial.print(TempC);
  Serial.println();
  delay(30000);
}
I modified my console script to add having it insert a time-stamp before the values being received by the serial monitor.
#!/usr/bin/python

import serial,time
ser = serial.Serial('/dev/ttyACM0', 9600)
while 1:
if(ser.in_waiting >0):
line = ser.readline()
    line = line.rstrip();
        timestamp = time.strftime("%Y-%m-%d %H:%M:%S", time.localtime())
        print('"{}",{}'.format(timestamp,line))
To invoke data collection, I first insert column headings into the file and then use nohup to start the script, so it will insert the readings into a textfile with time-stamps.
echo date,light,temp >lt.csv
nohup console >>lt.csv &
Here's what the data look like:
date,light,temp
"2019-09-25 14:20:56",894,29.59
"2019-09-25 14:21:26",882,29.59
"2019-09-25 14:21:56",892,29.59
"2019-09-25 14:22:26",882,29.59
"2019-09-25 14:22:56",891,29.59
A simple way to use the data is to install a webserver (like apache)
sudo apt-get install apache2
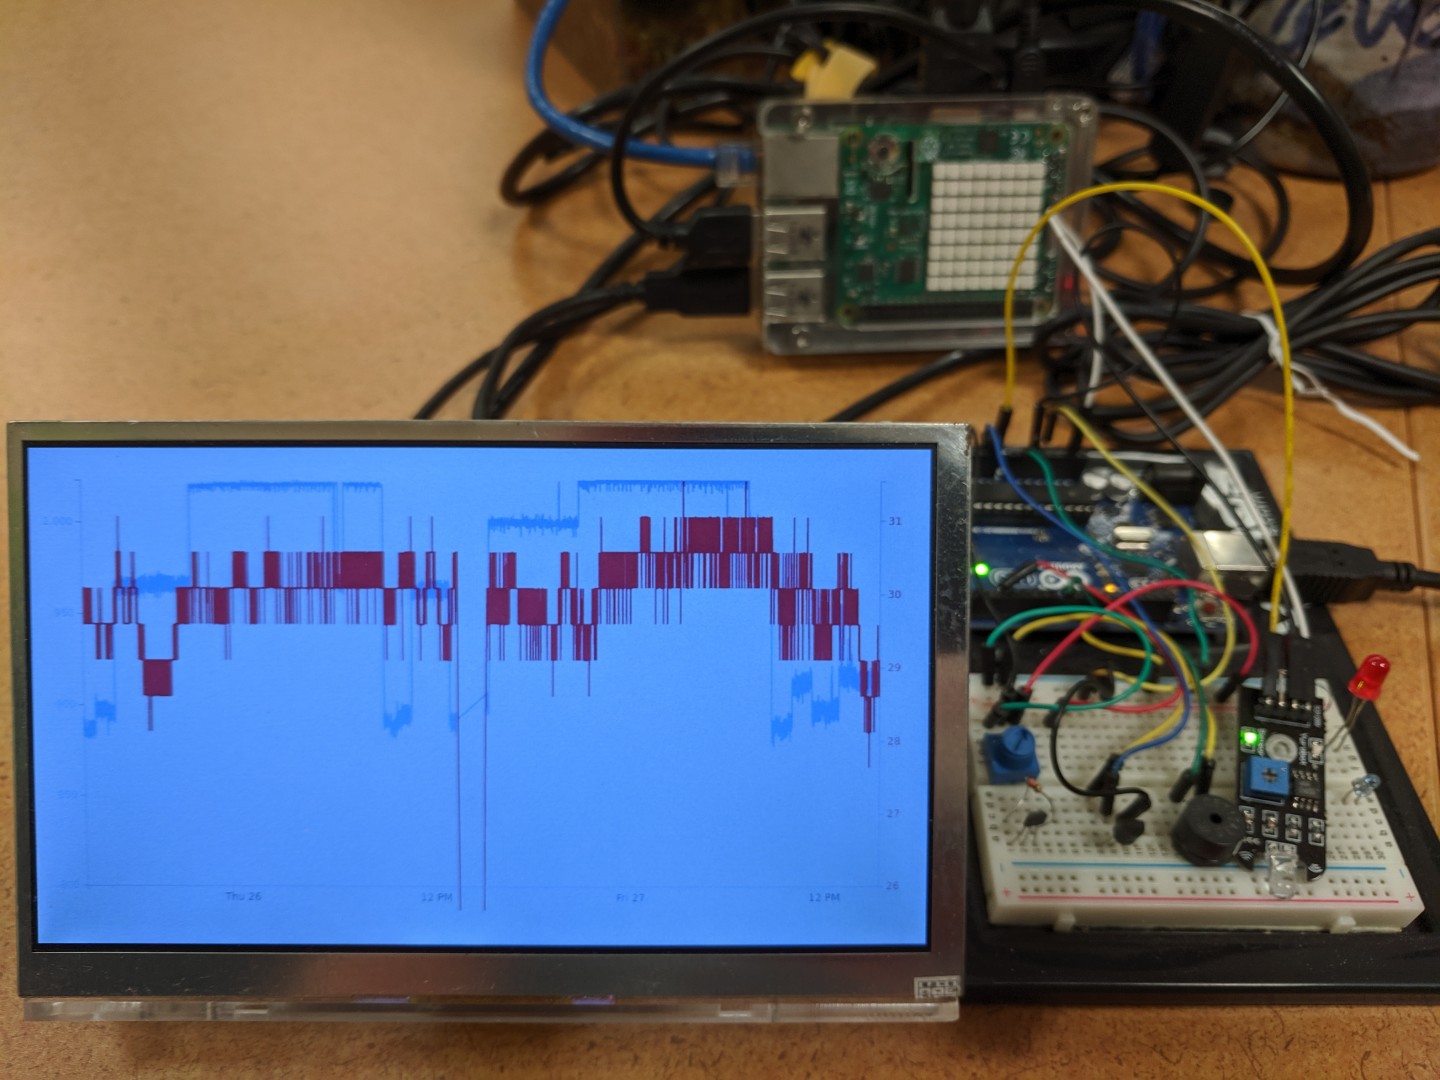
and then use D3 to serve out a webpage with a graph of the data. I used this example to create a graph which I can see by visiting the IP address of the raspberry pi with a web-browser.
But I can also use a raspberry pi for kiosk mode recipe to have a web-browser run, full screen, on the attached display and show the graph. You only have a to install a few packages and then change the configuration to load the URL: http://localhost/ and, Voila!
Some questions I've come up with: I can see the resolution of the temperature and light scales are pretty granular. It might be a good exercise for students to learn how to use an amplifier to spread out a region of a sensor to give you more granularity in the range you're interested in.
There are various back-ends for storing data that might be worth considering too: a text file is simple, but limits what you can do with it. It might be worth using a database -- especially if you want multiple instruments that are all submitting their data to the same data set. This could also make it easier to select a slice of the data to display. If you are going to use a textfile, though, it might be worth learning how to use syslog (so multiple processes can write to a file) and log-rotate (so individual files don't grow too large.)
0 Comments
Login to comment.