I am un-officially a brand ambassador for tableau public - it's free and intuitive! I wanted to see how the location of polluters correlated with demographic data. I downloaded data from the EPA's National Emissions Inventory here.
The data I used was 'Point Source Contributions.' The 'download data' button at the bottom is going to download as a text file (at least when I did it) with ALL of the national data included, which was going to be super hard to quickly parse. But, I learned that if you right-click the auto-generated table on the right of the screen, it gives you an option to download filtered data as an excel file - yay!
Check out the visualization I made here. The map is interactive and you can filter by Pollutant or Facility type, hover over the points to see more information, and zoom in and out. I also overlayed the map with Census data that tableau had in its software package. There are four different tabs for Black, Hispanic, White, and Household Income. Note: some of the big dots are actually multiple smaller dots. The blue outlines denote different counties. Darker map areas means a greater density. I have only plotted point sources for Providence County.
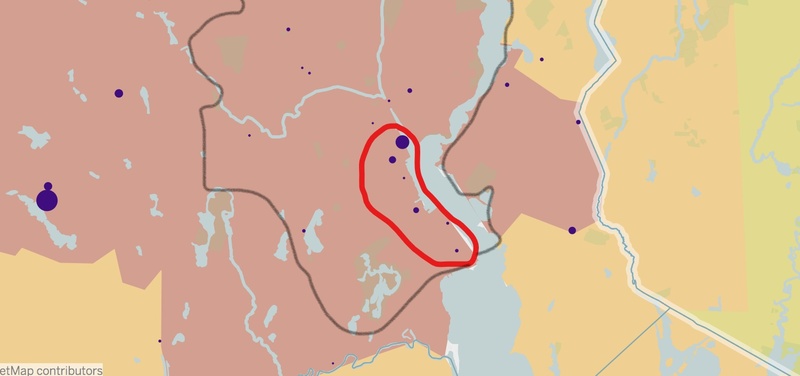
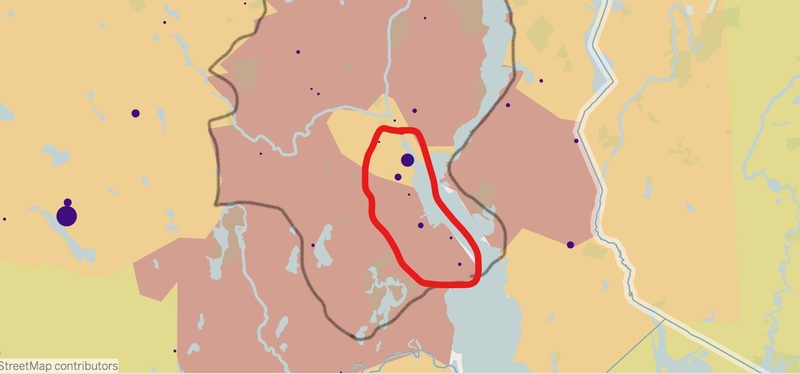
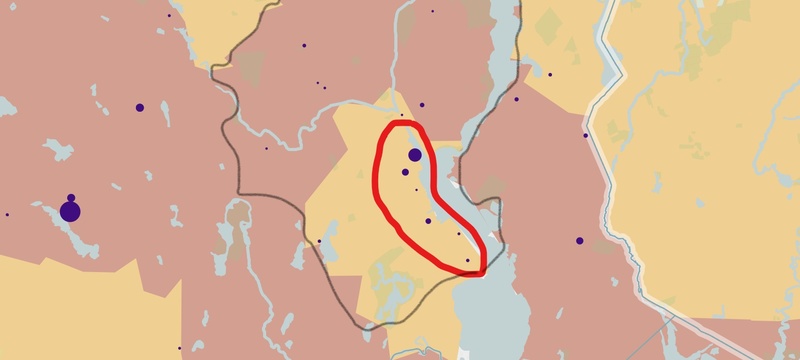
The area circled in red in the following photos is known as the "Port of Providence" where groups such as FANG collective and the Environmental Justice League of RI have been battling the state from permitting a new facility to be built on the grounds of environmental racism against Black and Brown people. Although there are certainly other parts of Providence County with emissions that are concerning to other populations, within the boundaries of Providence the city (roughly outlined on the following maps in black), it is clear that Hispanic and Black populations are exposed to the highest concentration of point source polluters in the city.
Location of Point Source polluters overlayed with Hispanic population density

Location of Point Source polluters overlayed with Black population density
Location of Point Source polluters overlayed with White population density

I acknowledge that there are other census categories, racial, gender, education and otherwise that would be interesting to see and I invite others to do so!
Thanks!

0 Comments
Login to comment.