Is your neighborhood creek littered with trash? Is there a way to measure how much trash there is within the creek? Can you involve elementary and middle school students to measure this trash in a safe and fun way?
Who we are
The Trash-tography project was developed by the fourth-graders of Carver Elementary School, San Diego, as part of a community science project of the Thriving Earth Exchange program. Teacher, Kristen Hurst, aims to raise awareness about the amount of trash in the neighborhood creek. She also wants to involve her students in this effort so that they can become environmental stewards of their community
Thriving Earth Exchange connected Kristen to a group of scientists. As a team, we modified the SWAMP Rapid Trash Assessment protocol to make it accessible to kids. With guidance from the team, Kristen's students conducted three on-site trash assessments of Chollas Creek using this survey. We lay out the full story of our project here.
What is Trash-tography?
Trash-tography is method of visual survey to monitor trash in creeks. This survey (materials below) is based on the Rapid Trash Assessment Protocol, developed by the Surface Water Ambient Monitoring Program (SWAMP) of the California State Water Resources Control Board. The survey assigns scores to sections of the creek depending on the amount, toxicity, and source of trash. We have modified the original survey to make it more accessible to elementary and middle school students. And we have transferred it to a Google Form so that it can be operated with digital devices such as iPads or smartphones. The survey can be be done either on-site, or using photos where the site may be unsafe for, or inaccessible to, students.
Details of our project
The following is the procedure for conducting trash assessment.
The tools you may need:
- A copy of our trash assessment Google Form
- Digital devices, such as ipads or smartphones, for each participant to access the survey
- A long measuring tape, at least 100 feet in length
- Pins or clipboards to partition the site into 10 sections along the tape measure
First, distribute a link of your copy of the Google Form to all the students (or groups) conducting the survey. For Google Forms to store all collected data in the same place, a common link must be used. Next, identify a creek location where you can safely conduct a trash assessment over a 100-foot section. Lay the measuring tape out along your creek section. Although the original survey is designed for a single assessment over the 100-foot section, we recommend dividing this up into 10 subsections for elementary school students. Each pair or group of students is assigned one subsection to survey, and results are aggregated at the end.

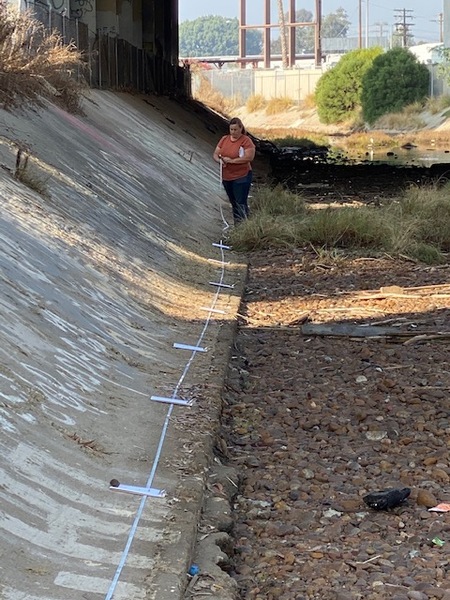
- Kirsten Hurst, laying out the tape measure and marking 10-foot subsections.
Once the sections are laid out, take photos of each subsection for both record-keeping purposes. The trash assessment can then be done either in-person or using the photos. If done in-person, it is still important for students to take photos to refer back to when discussing results. Direct the survey conductors to follow the instructions in the Google Form and remind them to record what subsection they are working on, as well as other basic observations when prompted by the Google Form. We recommend a classroom session to go over the project, goals, and terms prior to taking the students into the field. Be sure to encourage students to ask questions as they are filling out the survey.
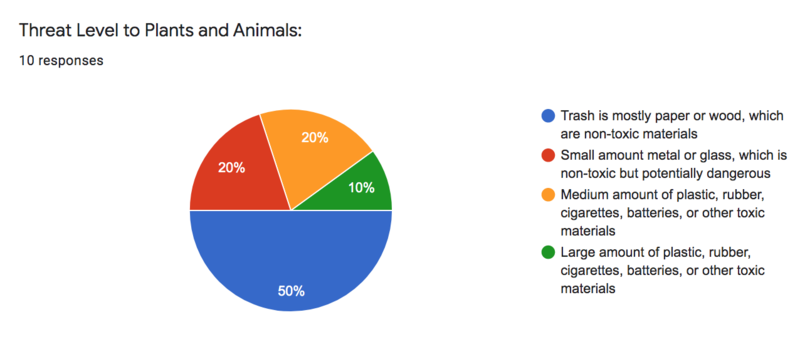
Once the survey is submitted, Google Forms has inbuilt tools to summarize the results, which is a great way for students to visualize the data they've collected.
You can further adjust the trash assessment as you see fit for your students. You can conduct surveys at various creek sites, and as often as you would like to track long-term or seasonal changes in the amount of trash in your community creek.
Please do not hesitate to reach out to us (ikcal11@gmail.com) if you have any questions.

5 Comments
Thanks for showing this accessible protocol in action, all the way through to how the visualized data looks at the end - very helpful!
Thanks Liz, we appreciate you checking out our project!
Reply to this comment...
Log in to comment
@ikcal11 has marked @cjellis as a co-author.
Reply to this comment...
Log in to comment
@ikcal11 has marked @kskadberg as a co-author.
Reply to this comment...
Log in to comment
@ikcal11 has marked @khurst as a co-author.
Reply to this comment...
Log in to comment
Login to comment.