Purpose: Oil Testing Kit Beta Testing
These are sets of spectra scanned using my Public Lab spectrometer and the oil samples provided in the Oil Testing Kit. As a beta-test contributor, my aim is to contribute to the data that will allow us to evaluate the precision of the spectra obtained by a single tool and the reproducibility of spectra obtained by multiple tools.
Attempts and Results
Note that a lot of my spectra have very low intensities, such that I need to re-analyze those samples to get useful data. I am posting the results from all of the oil samples, but plan to re-do Auto Diesel, 5W30, and probably 20W50 too. The reason the spectra have such low intensities is that I did not notice that my attenuator was inserted, and it was as low as it would go, obscuring quite a bit of light. I will re-analyze them, being sure to remove the attenuator!
To compare the spectra, as the beta tester instructions detailed, I took triplicate scans of each type of oil and saved them as a set. I smoothed the curves, and then used the function "Find graph centers only between 410-700 nm." Jeff (@warren) and I have had a discussion about using this function, and also about reporting the lambda-max (the wavelength at which fluorescence intensity is greatest), which is likely to be impacted by the webcam's differing sensitivity over the range of wavelengths, especially at the edges of each band (R, G, B). Here, I report the graph centers and lambda maxima for each spectra within each set.
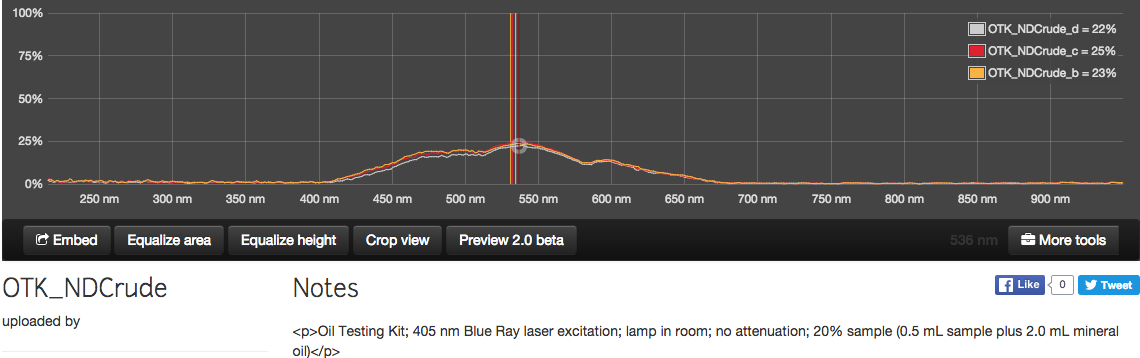
North Dakota Crude:

North Dakota Crude Graph Centers: * scan b: 534 nm * scan c: 531 nm * scan d: 530 nm
North Dakota Crude Lambda-Max: * scan b: 532-542 nm * scan c: 536 nm * scan d: 533-541 nm
80W90:

80W90 Graph Centers: * scan a: 479 nm * scan b: 481 nm * scan c: 489 nm
80W90 Lambda-Max: * scan a: 468 nm * scan b: 465-473 nm * scan c: 466-477 nm
For 80W90, reported precision is much better using lambda-max, even though there are ranges.
20W30:

20W50 Graph Centers: * scan a: 464 nm * scan b: 468 nm * scan c: 481 nm
20W50 Lambda-Max: * scan a: 436-439 nm * scan b: 462-468 nm * scan c: 464-468 nm
These shapes of these spectra are not very similar, and warrant a re-do.
5W30:

The recorded intensities are too low and the peaks are too broad to actually provide useful information. I am simply posting here to provide a complete (albeit flawed) set.
Auto Diesel:

Auto Diesel Graph Centers: * scan a: 460 nm * scan b: 462 nm * scan c: 464 nm
Auto Diesel Lambda-Max: * scan a: 436-441 nm * scan b: 431-450 nm * scan c: 436-444 nm
The intensities recorded here are, again, too low and too broad to be very useful and warrant a re-do.
Mineral Oil:

Mineral Oil excitation light wavelengths: * scan a: 391 nm * scan b: 393 nm * scan c: 393 nm
I thought this was interesting, as the excitation source was the same Blue Ray laser, and there is some variability in the recorded wavelength. I think the variability observed here is more likely due to the spectrometer than to the light source itself.
Two questions arise for me here regarding the excitation light: * (1) The Blue Ray laser is reportedly 405 nm, so is my calibration way off? * (2) All of my spectra except the ones for crude oil include this incident light in the 390-400 nm range. Did I fail to have my spectrometer snuggly engaged with the cuvette-holder attachment such that incident light entered my spectrometer in all of my analyses except for the ones I did with crude oil? Again, this warrants a re-do.
Next Steps:
- Analyze Auto Diesel, 5W30, and 20W50 with the attenuator removed.
- Try diluting samples in mineral oil and observing any effects of dilution on the shape or position of the fluorescence spectra.
- Try mixing oil samples and observing whether or not it is possible to discern the different oil components of the mixture from the mixture spectra.
3 Comments
Links to spectra sets in Spectral Workbench:
ND Crude set: https://spectralworkbench.org/sets/2905
80W90 set: https://spectralworkbench.org/sets/2904
20W50 set: https://spectralworkbench.org/sets/2903
5W30 set: https://spectralworkbench.org/sets/2902
Auto Diesel set: https://spectralworkbench.org/sets/2900
Mineral Oil set: https://spectralworkbench.org/sets/2901
Reply to this comment...
Log in to comment
Hmm, how did you use the bike light to calibrate your spectra? If it's an LED, it doesn't have the characteristic peaks that the calibration procedure is designed to recognize. Are you doing a "custom calibration" as described on the spectral workbench calibration page? https://publiclab.org/wiki/spectral-workbench-calibration
Is this a question? Click here to post it to the Questions page.
Reply to this comment...
Log in to comment
Good call, @ethanbass! That is exactly my problem -- I was using my regular LED bike light instead of a CFL. Thanks!!!
Reply to this comment...
Log in to comment
Login to comment.