Objectives of this Activity
- Understand aspects of data quality
- Determine if a dataset is “clean”
- Apply common data cleaning steps
What is Clean Data Anyway?
What does it mean to have “clean” data? Conversely, how do we know if our data is not clean? Before determining how clean your dataset is, make sure you have a good understanding of the “metadata”, i.e. what is being measured, what the units are, how the data was collected (if possible), what each field represents, special values, and any particular considerations or limitations of the dataset.
After reviewing the metadata, you can use these categories to qualitatively assess how clean your data is:
Validity
- Does the data defy any constraints?
- Are there values that are not in the allowed set of values?
- Are there data types that are not in primary data type(s) of a column?
- Are there duplicates?
- Are there values that do not follow the allowed pattern?
Accuracy
- Can the data be reasonably trusted to represent true values and trends?
- Is the data collection process sound?
- Are there known errors that can be corrected?
Completeness
- Is all expected data available?
- Are there missing rows, columns, or data points within a record?
Consistency
- Do multiple different data points for a single record corroborate each other, or are there contradictions?
- Within a single column, are data types consistent?
- If there are multiple files for the same data, are they structured in the same way?
In this example, we will be using OpenRefine, a free, open source, standalone tool for exploring, cleaning, and transforming data, that runs offline in a web browser. However, the concepts behind data exploration and cleaning can be implemented with other tools (e.g. Google Sheets, Microsoft Excel, SAS, R, Python)). Follow these steps to get started with OpenRefine:
- Download OpenRefine, extract the folder, and run the OpenRefine application to open it in a browser
- Import your data by selecting the appropriate source location on your computer

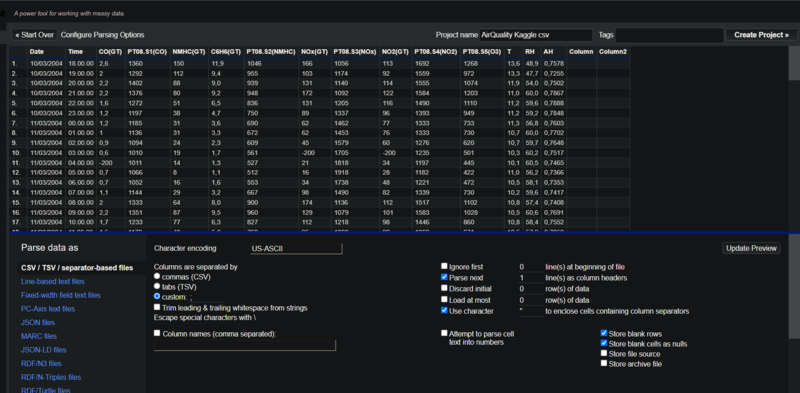
In this example, we will be using this air quality dataset that you can download to your computer. - Click “Next” and review the import options. For text files, use UTF-8 as your character encoding. For numeric data, I suggest checking the “Attempt to parse cell text into number” box. Update your “Project Name” on the top right side. Review these options carefully because once you click “Create Project”, you can no longer return to this screen!

- Click “Create Project”, to access data exploration and cleaning tools, as well as see a preview of your data. Note that green values are numeric values and white values are text.

Explore Your Dataset
In this step, you can use the data quality parameters as a way to guide your data exploration, while also using your creativity and subject matter knowledge to gut-check trends and values. Some examples of exploration you can do:
Completeness: Count unique values in text columns. Go to the dropdown, hover over “Facet”, then click “Text facet”

You can now see the number of rows associated with each value on the left hand panel
Consistency, Validity: Check for dummy/placeholder values, blanks, and data type inconsistencies. After reading the “Content” section that explains the dataset, you learn that “-200” is a placeholder value for missing values, so you can check how often this appears in your data by going to the dropdown next to a column name, hovering over “Facet”, then clicking “Numeric facet”.

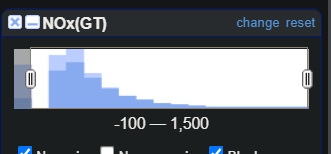
Go to the left-hand panel, then review the numbers under each checkbox to look for unexpected data types. In this case, there are no non-numeric values, but there are blank rows.
 Then filter to the dummy value (-200 in this case) by dragging the number range slider. In other datasets, the dummy value may be a different number or even a text string. Once you’ve applied the filter, look at the number of rows below your project name. In this case, a significant portion of rows under NMHC (GT), which indicates Non Metanic HydroCarbons concentration, have the placeholder -200 value.


Validity: View histogram for numeric to understand distribution of values and identify invalid values. Go to the column dropdown > Facet > Numeric Facet, and view the small histogram on the left associated with the column.

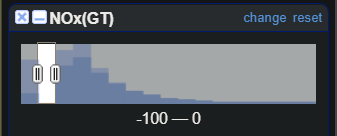
You can also check for invalid values. Because this is a NOx measurement, we do not expect any negative values, and we can confirm that by dragging the range to -100-0, excluding the dummy value of -200 as it is a placeholder for missing values. In this instance, there are no rows with invalid values in this column. If you do see invalid values, it’s worth further examining those rows and eventually excluding them.

Apply Data Cleaning
- Remove leading/trailing whitespace
- Dropdown > Edit Cells > Common Transforms >Trim leading and trailing whitespaces
- Filter out placeholder values and/or blanks
- Follow the text and numeric faceting instructions in the Data Exploration section, and set up the checkboxes and range sliders to the values you want to keep
- Replace characters within cells
- Dropdown > Edit Cells > Replace > Input values to find and replace
- In this case, I am replacing commas with periods in numeric columns to convert the European number representation style to an American one

- In this case, I am replacing commas with periods in numeric columns to convert the European number representation style to an American one
- Remove outliers in numeric columns
- Dropdown > Facet > Numeric Facet
- Review the histogram and remove very large and very small values if you believe they are errors

- Replace whole cell values
- Dropdown > Facet > text or Numeric Facet > Click on “edit” to the right of the value you want to edit, then input your desired value to update all instances of this value in your selected column. Hit “Apply” to save

- Dropdown > Facet > text or Numeric Facet > Click on “edit” to the right of the value you want to edit, then input your desired value to update all instances of this value in your selected column. Hit “Apply” to save
- Change data type
- Dropdown > Edit cells > Common Transformations > select appropriate data type
- Values formatted as numbers or dates will be green
- Join values from columns
- Dropdown > Edit column > Join columns > select the columns you’d like to join and any other relevant parameters

- Dropdown > Edit column > Join columns > select the columns you’d like to join and any other relevant parameters
Further Reading
- The Ultimate Guide to Data Cleaning: Tool-agnostic concepts for data cleaning and transforming.
- Get Started with OpenRefine: Explore, Clean, and Transform your Data!: More detailed step-by-step guide on using OpenRefine, with video tutorial.
- Data Preparation and Normalization with OpenRefine: Instructions for data cleaning steps beyond those covered in this activity.
1 Comments
Thank you! This is very helpful.
Reply to this comment...
Log in to comment
Login to comment.