Origin of the word “science” Latin Scientia- know
This is a fundamental tutorial using the Red dye Safranin O, to illustrate the steps for preforming absorption spectra, irregardless of whatever data processing software you are using or not.
I am using the Public Lab v2.5 Spectrometer to demonstrate these steps. The processing and capture software I used was Spekwin32 v172.2p5 proto type, although I know that Jeff @Warren and Dave @Stoft are working diligently to incorporate this feature into Spectral Workbench. I'm no graphic artist, so please bear with this presentation, I have made every effort to be as accurate as possible, but there can still be a margin of error.
The Set Up: 1)Measure:
a) first spectrum without sample. Let's call it reference spectrum (your SOLVENT)
b) second spectrum with sample. Let's call it sample spectrum (in this case Safranin O)

In the plot above, it is important to make sure that the spectrum for the solvent is as steady and uniform as possible, with whatever white light source you are using. When transferring form the solvent cuvette to the sample cuvette, it is equally important that, nothing changes, ie.,light source, spectrometer alignment, ect.,
You will notice that the intensity changes when the sample container is placed in the light path...do NOT try and re-adjust the light source or re-align the spectrometer to compensate for this, I already did this, yes I know, and it will invalidate everything!
Good, lets continue...
2)Calculate:
a) the transmittance spectrum by a division: transmittance = sample / reference.
b) the absorbance spectrum by applying a logarithm: absorbance = -1 * log(transmittance)
That's all. No subtraction involved, but a division.
Some more hints: - As long as the light source is stable both in intensity and spectrum shape, you don't have to repeat the first step (a) for every sample measurement.
In order to obtain the absorbance properties of only the sample without influence of container + solvent, step 1) is done with a sample container filled with the solvent used for the sample measurement. Of course, the both containers should then behave identical for reference and sample measurement.
Negative transmission is meaningless. Transmission above 100% is meaningless. If this occurs, errors have occurred (lamp intensity drifting, swapped sample/reference, ...)
absorbance and transmittance spectra have a "common data base", you can display any absorbance spectrum as transmittance and vice versa. However, you cannot (!) display an intensity spectrum as absorbance. this would be totally meaningless.
For any work on concentration determination, you have to go to absorbance domain. Only there you can use the Lambert-Beer relationship.
After your sample is divided by the solvent reference spectrum, it will look something like this:

Now, depending on your software, you can look at the data for your spectra to find the absorption data that you just acquired, in this case it is for Safranin O. Lets take a look at that data:


The first set of information is for absorption, and highlighted is the one we are looking for at 526nm, this is the max absorption for Safranin O in a 6 to 24% concentration of Methanol. The next set of data points are for transmission. which is related to absorption.
This is how I know that I really have a sample of Safranin O!
The next plot is going to illustrate how we can figure out what our concentration is of our sample, although I already know what it is, not only am I verifying it, but this procedure would be used in a similar fashion for an unknown concentration, where you would do a scan of 5 to 8 samples of differing dilutions.

Now, to my surprise, I didn't realize that Safranin O fluoresced. So I was able to do both, an absorbance plot and a fluorescence plot.

The exciting thing about all this was, that my plots were experimentally in range of the published literature for Safranin O in Methanol!
The next graphic will illustrate the data for both the absorbance and fluorescence for our sample of Safranin O:


References
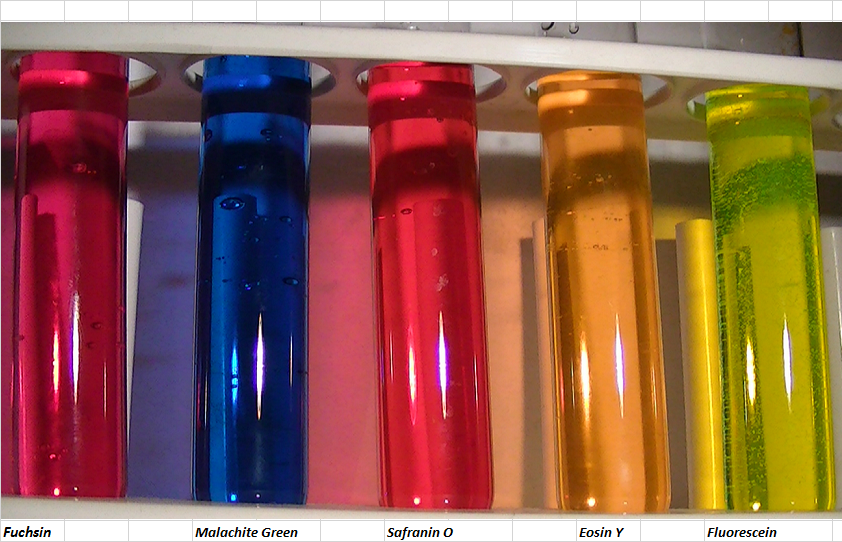
http://spectralworkbench.org/sets/3285 - ABtest01 - absorption spectra of 5 biological stains
http://www.emdmillipore.com/US/en/product/New-fuchsin-%28C.I.-42520%29,MDA_CHEM-105226?bd=1 - fuchsin
http://micro.magnet.fsu.edu/primer/photomicrography/bwfilters.html - absorption spectra for various stains
http://shodhganga.inflibnet.ac.in/bitstream/10603/9919/9/09_chapter%204.pdf – Absorption and Fluorescent Spectra of Safranin O, Pg.93 SEC. 4.5.1.2
http://www.researchgate.net/publication/10769812_Spectral_studies_of_safranin-O_in_different_surfactant_solutions - Safranin O in Methanol
http://www.umich.edu/~chem125/softchalk/Exp2_Final_2/Exp2_Final_2_print.html Chem 125 Experiment II step by step instruction for absorbance measurements and plotting
2 Comments
Thanks for sharing this tutorial. It's quite helpful for me to understand fluorescence spectra and fluorescent labeling (http://www.bocsci.com/Fluorescent-labeling-of-proteins.html)
Reply to this comment...
Log in to comment
@Aspen Hey aspen, thank you, I am very happy that this was so helpful for you, I checked out your link and those are also the kind of resources that are very helpful also.
Reply to this comment...
Log in to comment
Login to comment.