****ABSTRACT Crude oil analysis (sweet crude) Laramine county carpenter Wyoming USA (Late Cretaceous Niobrara shale)
Crude oils contain significant quantities of chromophores, which are not fluorophores. by chromophore we mean molecules, which absorb light in the wavelength range of interest. Fluorophores obviously are fluorescent; all fluorophores are chromophores, but not all chromophores are fluorophores.
In this series of testing, I used 3 different excitation light sources; a 395nm high power Uv LED, 470nm high power Blue LED and a 532nm green laser.
The idea is, at specific wavelengths, we can calculate the quantum yields of the non-fluorescing chromospheres and at the higher wavelengths such as @ 470nm and 532nm, we can see that the collisional energy transfer of molecules becomes less of a factor and molecular properties become more dominant at the longer wavelengths (redshift.)
****Introduction
Fluorescence spectra and quantum yields provide us with a wealth of very useful information as it relates to the study of crude oils and their unique organic properties. My studies into this field are multi-faceted, in that I am trying to develop a universal standard for analyzing not only crude oils, but any type of oil that may potentially be an environmental hazard, both on land or at sea.
So as I strive to uncover their systematic optical properties, I develop a better understanding of their dynamic behavior, for example, the electronic absorption edge for all crude oils and asphaltenes exhibit the Urbach tail (exponential profile) and is related to the distribution of chromophores.
*Here I wanted to establish the variations of emission spectra at different excitation wavelengths using a variety of concentration levels. Two oils were used in this study; one was sweet Wyoming crude and 2 stroke motor oil. I investigated the collisional energy transfer variations from the UV to the redshift >600nm range. I was able to find a suitable crude oil reference data point for my quantum yield calculations, I am comparing all samples against Nigerian light crude oil which it’s quantum yield standards vary, and can be as high as 100 percent +. This is well documented in the literature and is not uncommon.
The reason I used the Nigerian light crude as my reference is, its fluorescence emission is integrated from 320 to 699 nm, and excited with 308 nm wavelength, and is arbitrarily set to have an efficiency of one. Instrumentation used was a Perkin Elmer Model 650-40 Spectrofluorometer.
*based in part on “Visible an near- Infrared Fluorescence of crude oils Taggart D. Downare and Oliver C. Mullins, Schlumberger-Doll research, old quarry road, Ridgefield, Connecticut. Vol-49, number 6, 1995
****Experimental
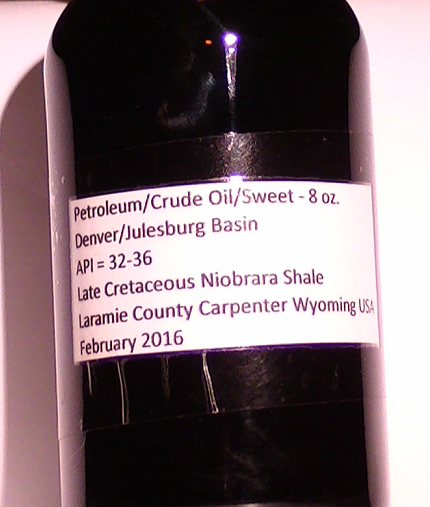
Crude oil sample- Petroleum/crude oil/sweet/Denver/Julesburg Basin *API = 32-36 Late Cretaceous Niobrara Shale/Laramie County Carpenter Wyoming USA/February 2016
2 stroke motor oil- 50:1 oil/multi-mix USA Solvent- Ethyl Acetate 88.11 g/mol CAS No. 141-78-6/C4H8O2 Cuvettes- semi-micro/UV transparent 1.5ml capacity/plastic disposable (made in Germany) Disposable pipettes 14ml capacity centrifugal test tubes/ used for mixing and preparing samples
Sample preparations are as follows: transfer 1.5ml undiluted crude oil to empty cuvette, this is your control sample. Pipette 3ml crude oil to centrifugal test tube (when transferring, pipette from the bottom of the tube, move upwards to avoid smearing the sides of the tube.) Next, pipette the same amount of solvent (3ml,) into the test tube, and shake vigorously, this is your reference sample (sample number 6.)
5 cuvettes will be used- 1 for the control sample, 1 for the reference sample (6) 1 for the 2 stroke undiluted motor oil sample, 1 for the 2 stroke motor oil sample dissolved in ethyl acetate and 1 for samples 1 through 5- this will be for your concentration readings.
To prepare the concentration samples: Utilize cuvette number 5 for this, transfer 1ml ethyl acetate to cuvette and place it in the spectrometer cuvette holder and do not remove throughout testing. ALL measurements relate to the disposable pipettes- average volume weight per drop = 0.015.8g (15microlitres)
Follow this sequence: Sample (1) 1 drop crude oil = 0.016g Sample (2) 2 drops = 0.033g Sample (3) 3 drops = 0.049g Sample (4) 4 drops = 0.064g Sample (5) 5 drops = 0.079g Your reference sample should weigh by volume/1.177g/solvent + crude oil (1.5ml) Weight by volume breakdown = 0.911g ethyl acetate/0.266g crude oil = 1.177g total weight by volume @ 1.5ml
These weights need to be very exact for the reason of calculating quantum yields and the fact that I could not find a master reference to work from. So now, when we add the total volume weight of samples 1 through 5 we get 0.241g, add the average weight per drop from the pipette and we get 0.2568g with a difference of 0.0092g for error correction against our reference sample of 0.266g of crude oil.
This translates to an error of 3.5 percent, so now we have a confidence rating of 96.5 percent for all our calculations. Instrumentation used: DH 4.2 (build 4.0.1) homemade spectrometer/ ELP-USBFHD01M-L21 CCD camera
Excitation light sources: 390nm 1W 350mA 4.0vdc Uv LED, 470nm 1W 550mA 4.0vdc blue LED and an Aries 532nm 20mW green laser.
****note all concentration calculations and graphs were done before normalization of data. “normalization” of data where indicated.
Processing software: spekwin32 v172.2P4 control prototype All spectra have had Rayleigh/Raman scattering removed prior to smoothing data. API- American Petroleum Institute/ is a measure of how heavy or light petroleum liquid is compared to water: if its API gravity is greater than 10, it is lighter and floats on water; if less than 10, it is heavier and sinks.


****Discussion/Conclusions
As in a previous study I did on the viability of using ethyl acetate as a primary solvent for processing oils for sampling; http://publiclab.org/notes/dhaffnersr/04-29-2016/uv-laser-pointer-405nm-5mw-2-stroke-motor-oil-related-testing-apr-29-2016 , this solvent worked very well in this series of testing also. Homogenization of crude oil samples was complete within 30 seconds of transfer.
Point of discussion number two for using ethyl acetate as a primary solute is because the solvent chosen must dissolve the sample, yet be relatively transparent in the spectral region of interest.
In order to avoid poor resolution and difficulties in spectrum interpretation, a solvent should not be employed for measurements that are near the wavelength of or are shorter than the wavelength of its ultraviolet cutoff, that is, the wavelength at which absorbance for the solvent alone approaches one absorbance unit.
When looking at figure 1. We can see what I was touching on earlier in the abstract about the Urbach tail and the collisional energy transfer, as the wavelengths get farther out on the spectrum, molecular properties become more dominant. The Urbach tail now at 470nm and 532nm are very minimal. This could be due to the presence of asphaltenes that exist in all crude oils, their structures are not very well known but their effects on spectral analysis are prominent.
Fig 6. Was interesting @ the excitation wavelength of 532nm, because the Urbach tail became more prominent and sample number 6 quantum yield was quite low as compared to the control sample and even those of the other wavelengths. This could be due to appreciable interaction between chromophores directly linked to each other or forced into close proximity as a result of molecular stereo chemical configuration.
Fig 3. Is the reference upon which all quantum calculations were based (Nigerian light crude oil.) the rest of the graphical data are representative of that analysis. Some conclusions can be drawn I believe from some of the data, one being that ethyl acetate as a primary solvent for this type of analysis is sound. Two is, that the Urbach tail is a qualitive signature analytical tool to use for the identification of all crude oils, even possibly all oils since they are derived in part from a common source.
Third the collisional energy transfer between donor and acceptor molecules can be seen by observing the samples at different wavelengths. Asphaltenes, since they are so complex and difficult to determine their structures, cannot be quantified by using the equipment that was used to run this series of experiments.
****References: Catalogue of Optical Spectra of Oils-http://las.physik.uni-oldenburg.de/data/spectra/index.htm http://publiclab.org/notes/dhaffnersr/04-29-2016/uv-laser-pointer-405nm-5mw-2-stroke-motor-oil-related-testing-apr-29-2016 http://spectralworkbench.org/sets/3268 - crude oil 6 samples http://www.academia.edu/21925384/Visible_and_Near-Infrared_Fluorescence_of_Crude_Oils http://en.wikipedia.org/wiki/Asphaltene http://publiclab.org/notes/dhaffnersr/05-07-2016/further-explaining-quantum-yield http://publiclab.org/notes/dhaffnersr/05-07-2016/quantum-yield-calculations-for-fluorescein-in-potassium-bromide
1 Comments
Supplemental experimental data related to above research study:
Reply to this comment...
Log in to comment
Login to comment.