About Me
Hello ! I am Shubhangi Chauhan. [ People tell me my name is a little difficult to pronounce, so, you can call me Shubhi. :) ] A Computer Science undergrad from Banasthali University, Rajasthan - India [Batch of 2018], now preparing for my business school entrance exams for next sessions. I have submitted patches to Open Humans API in the past, starting in opensource was well guided (cheers to the community!). I'm finding contributors, mentors at Public Lab extremely inviting; as @quinn-codes-synthesis rightly pointed out, the pretty problem with Public Lab is having more first-timers than first-timer-issues!
Project Description and Summary
Extend community collaboration statistics and visualization system for PublicLab.org This project builds on the existing community metrics system, viewable at http://publiclab.org/stats, which provides statistics and insights into community trends and activity, similarly to GitHub Pulse (https://github.com/publiclab/plots2/pulse/).
Problem
Our statistics system is already quite powerful, and many of these tasks address consolidating different features which were added at different times over the years, resulting in a messy interface. Others address the concern of performance with basic caching. A new system we propose as part of this project will display the same kind of data that’s currently available, but filtered by topic, using our site’s tagging system.
Finally, this project will include better user interfaces for selecting specific date ranges, as well as better display of data in graphs, especially when viewing specific selected date ranges (currently this data is shown only numerically).
Tasks
Back-end sub-projects to collect this data:
- providing downloadable JSON and/or CSV data from various stats pages
- providing new statistics on the # of questions answered versus questions asked (from the questions page at https://publiclab.org/questions/)
- weekly caching of data to address the performance issues that may result from collating so much data, and noting this in interface so people know when reports were generated
- consolidation of our existing "range pages" like https://publiclab.org/stats/range/10-05-2015/10-05-2016/ with the main stats page at https://publiclab.org/stats
- displaying tags most used in a given period (and linking into per-tag stats, below)
- a default display of contributors "for all time" on the /stats page
A new section of the stats page called "Statistics per tag" including:
- display of stats as above, but on a per-tag basis, via standard model functions with unit tests
- displaying a list of subscribers for each tag, based on: https://publiclab.org/stats/subscriptions
- closer mirroring between stats pages and tag pages (such as https://publiclab.org/tag/community - perhaps through a "graph" icon on the tag pages?
The project will also involve interface design projects to expand on the means of display for this data, to make it easy to browse and use:
- small "bar graph" icons around site which lead to appropriate pages in the stats system (using https://fontawesome.com/v4.7.0/)
- a date range selector for stats ranges (i.e. a calendar widget, or draggable date ranges like https://github.com/publiclab/plots2/graphs/contributors?from=2013-11-07&to=2016-11-18&type=c
- ability to click bar graphs to open that actual collection of items in a view such as https://publiclab.org/tag/mobius
Stretch goals
- make statistics system compatible with (or readable by) GrimoireLab using https://github.com/chaoss/grimoirelab-perceval
Approach
ROUTES
- User Stats [http://publiclab.org/user/:username/stats]
- Admin Stats [http://publiclab.org/user/:username/admin_stats]
- Tags Stats [http://publiclab.org/tags/stats]
- Per Tag Stats [http://publiclab.org/tags/tagname/stats]
- Public Stats [http://publiclab.org/stats]
VIEWS
Dashboards : Customizable Stat dashboards essentially built of widgets, for user, admin, tags and public stats, to track / monitor / showcase role-specific key metrics in one place.
User Dashboard :
Most important metric for users is their contribution; knowing how often a user contributes and how the contributions are being used helps demonstrate the impact and prioritize efforts, and network; people and subscriptions.
    Widgets :
        - Contribution Graph
        - Streaks (log in, contribution - notes, wiki edits, comments)
        - User notes
        - User research notes
        - User wiki edits
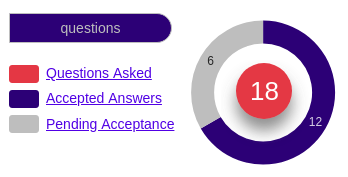
        - Questions asked vs answers accepted
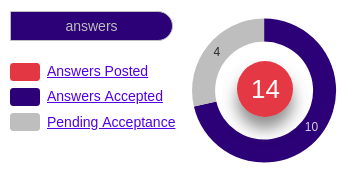
        - Answers posted vs answers got accepted
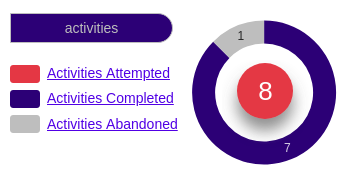
        - Activities attempted vs activity completed
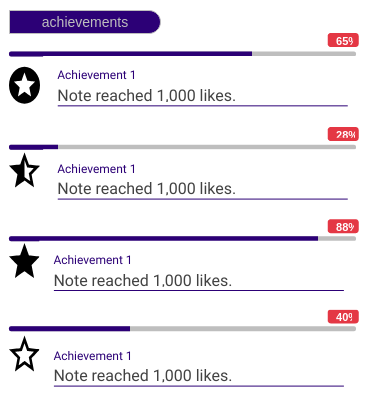
        - maybe introduce achievement badges too, like stackoverflow? users also get involved
Admin Dashboard :
Other than having a User Dashboard, admins may have an Admin Dashboard which would provide a way for the admins to monitor over-all user and publishing statistics, which are not really suitable for the public viewing.
    Widgets :
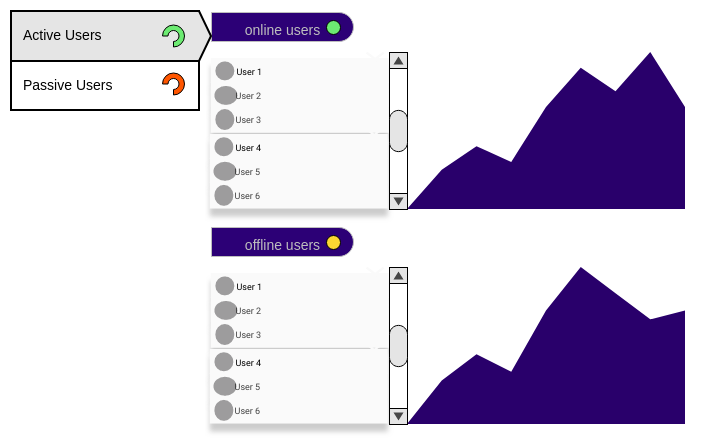
        - active users (logged in / loged out), passive users
        - moderate users, unmoderate users
        - ban users, unban users
        - new contributors
        - top contributors
        - popular (notes, wikis, activities)
Tags Dashboard :
Display of per-tag-statistics, via standard model functions
    Widgets :
        - trending, i.e. tags with higher mentions in recent time
        - tally of contributions tagged with the tag
        - subscribers
Public Dashboard :
Improving on the existing community metrics system, adding more features. Purpose is to ensures project metrics are front of mind for everyone, hence needs to be appealing and motivating.
    Widgets :
        - trending (notes, research notes, wikis, activities)
        - popular tags
        - contributors' tally
        - contributions' tally (notes, research notes, wiki edits, activities, questions asked, answered)
        - regions (heat map of active users)
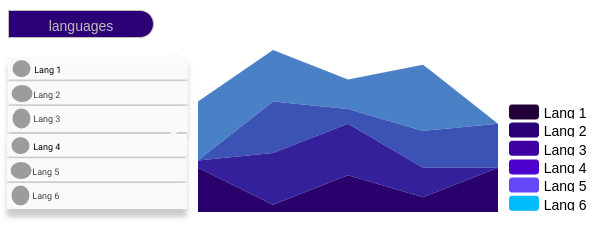
        - languages (tally of all user languages)
Widgets : Widgets are individual underlying metrics, which power the Dashboard System. Widgets pull the data with custom API queries, which specify the metrics and time periods that you want to track.
User Dashboard :
- Contribution Graph

- Streaks (log in, contribution - notes, wiki edits, comments)

- User notes
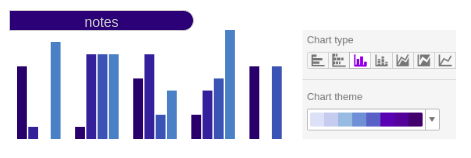
- User research notes

- User wiki edits

- Tags Used
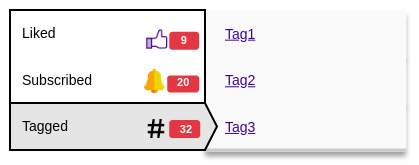
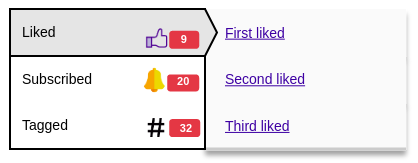
- Liked notes
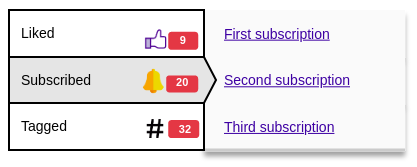
- User subscriptions
- Questions asked vs answers accepted
- Answers posted vs answers got accepted
- Activities attempted vs activity completed
- maybe introduce achievement badges too, like stackoverflow? users also get involved
Admin Dashboard :
- active users (logged in / loged out), passive users
- moderate users, unmoderate users
- ban users, unban users
- new contributors
- top contributors
- popular (notes, wikis, activities)

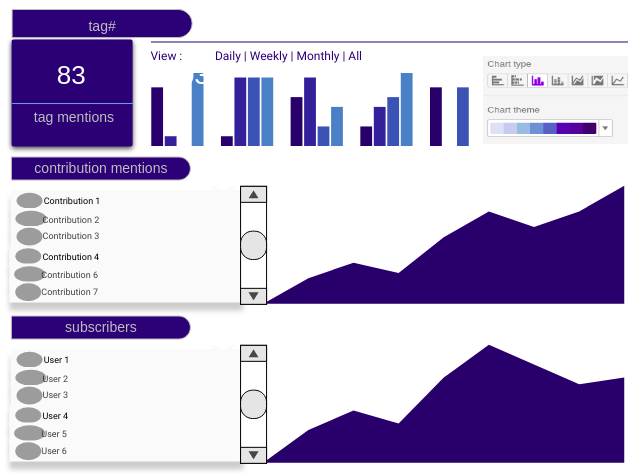
Tag Dashboard :
- trending, i.e. tags with higher mentions in recent time

- tally of contributions tagged with the tag
- subscribers
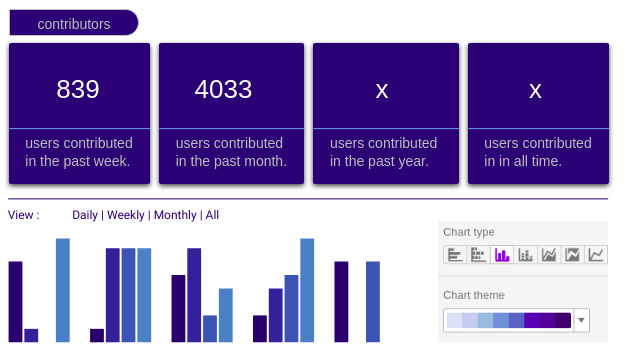
Public Dashboard :
- trending (notes, research notes, wikis, activities)

- popular tags

- contributors' tally
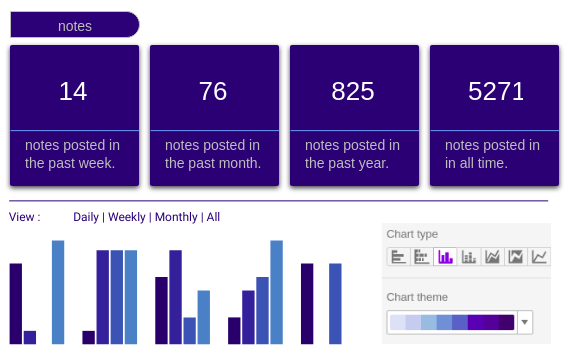
- contributions' tally (notes, research notes, wiki edits, activities, questions asked, answered)
- regions (heat map of active users)

- languages (tally of all user languages)
MODELS
Following is a list of existing models which can be used by the widgets. Any new methods that will needed by widget(s) will be created accordingly, as per the need. (Maybe, add a timestamp field to every action model (eg, subscribed_at for subscriptions), which would make range based queries convenient ?)
User.rb
    . node
    . user_tags
    . following_users , active_relationships
    . followers , passive_relationships
    . likes
    . revisions
    . created (datetime)
    . login (datetime)
    . timezone
    . language
    . notes
    . coauthored_notes
    . lat , long
    . tags, tagnames
    . subscriptions
        . following (tagname)
        . daily_note_tally
        . weekly_note_tally
        . weekly_comment_tally
        . streak
        . note_streak
        . wiki_edit_streak
        . comment_streak
        . barnstars
        . follow / unfollow
        . question
        . content_followed_in_period
        . self.contributor_count (all uses who've posted a node, comment, or answer in the given period)

Tag.rb
    . node
    . run_count
    . subscriptions
    . belongs_to
    . self.contributors (comments, answers, revision)
    . self.contriibutor_count
    . self.find_top_nodes_by_type(wikis, desc views)
    . self.find_nodes_by_type (tagnames, type)
    . self.find_pages(tagnames)
    . self.find_nodes_by_type_with_all_tags
    . self.find_popular_notes
        . self.follower_count
        . Self.followers
        . weekly_tallies
        . contribution_graph_making
        . self.nodes_for_period
        . self.subscribers
        . self.find_research_notes
        . followers_who_dont_follow_tags
        . self.trending
        . self.tagged_nodes_by_author
        . self.tagged_node_count

Revision.rb
    . created_at
    . updated_at
    . author
    . previous
    . next
    . render_body

Node.rb
    . updated_month
    . revision
    . comment
    . answers
    . total views
    . self.weekly_tallies
    . self.contribution_graph_making
    . answered
    . has_accepted_answers
    . likers
    . revisions
    . revision_count
    . comment_count
    . author
    . coauthors
    . subscribers
    . created_at
    . updated_at
    . responded_to
    . responses
    . response_count
    . has_power_tags
    . power_tag
    . power_tags
    . map
    . lat , long
    . next_by_author
    . prev_by_author
    . add_comment
    . new_revision
    . barnstar
    . mentioned_users
    . self.find_notes
    . self.find_map
    . self.find_wiki
    . self.research_notes
    . questions
    . activities
    . upgrades
    . is_liked_by

Drupal_user.rb
    . created_at
    . role
    . moderate / unmoderate
    . ban / unban
    . new_author_contributor
    . new_contributor
    . likes
    . like_count
    . liked_notes
    . liked_pages
    . note_count
    . revision_count
    . node_count
    . notes_for_tags
    . user_tags
    . tag, tagnames, tag_count

Comment.rb
    . self.comment_weekly_tallies
    . self.contribution_graph_making
    . created_at
    . mentioned_users
    . followers_of_mentioned_tags
    . liked_by
    . likers

Answer.rb
    . likers
APIS
Route : [http://publiclab.org/api]
Widgets pull the data with custom API queries, which specify the metrics and time periods that you want to track. Need to create GET APIs with query system to support range based queries / changesets for requesting JSON/CSV data for widgets.
Maybe, take ideas from open humans API ?
UNIT TESTS
Widgets, being individual and independent units, or sets of multiple widgets together with associated data and procedures can be efficiently tested to determine whether they are fit for use.
Timeline / Milestones
[ I'll need help from the mentors in figuring out a viable and productive timeline. :) ]
First Time Contributions
- https://github.com/publiclab/plots2/pull/3821
- https://github.com/publiclab/plots2/pull/3818
- https://github.com/publiclab/plots2/pull/3819

5 Comments
@bansal_sidharth2996 @warren @sagarpreet
Reply to this comment...
Log in to comment
Hello, thanks for your proposal! Would you mind taking a look at some of the other proposals for a better sense of the format and types of information we're looking for? Thank you so much!
Is this a question? Click here to post it to the Questions page.
Reply to this comment...
Log in to comment
Can you please add more details?
Thanks for your proposal
Is this a question? Click here to post it to the Questions page.
Reply to this comment...
Log in to comment
@gauravano @bansal_sidharth2996 @warren @sagarpreet Apologies for the delay, I was off to my native place for Diwali celebration, hence had to reply on mobile internet. Hope you guys had a great Diwali too !
Updated my draft proposal.
Reply to this comment...
Log in to comment
Thank you!!
Reply to this comment...
Log in to comment
Login to comment.