
Image above: Detail of a neon sign of a Shindaiwa Power Broom.
I took Ebert along to do some chores yesterday and stopped to capture a few spectra of neon signs with red tubes. Unlike the red tube in the Cigars sign, all of these had actual neon in them.
This exercise was a good test of maintaining Ebert’s calibration and capturing consistent spectral images. I did rather poorly on both tests. If I tell Spectral Workbench to use the CFL spectra I captured before I left the house to calibrate the neon tube spectra, some peaks are as much as 4 nm from where they should be. For this type of calibration to work, the spectral line for a particular wavelength has to be captured in the image in the exact same place every time I take a new spectrum. I think all the parts of Ebert are solid enough so they don’t move, but something else is varying between spectra. In the image below, the spectra from different neon signs are aligned manually for presentation, so calibration does not apply there.
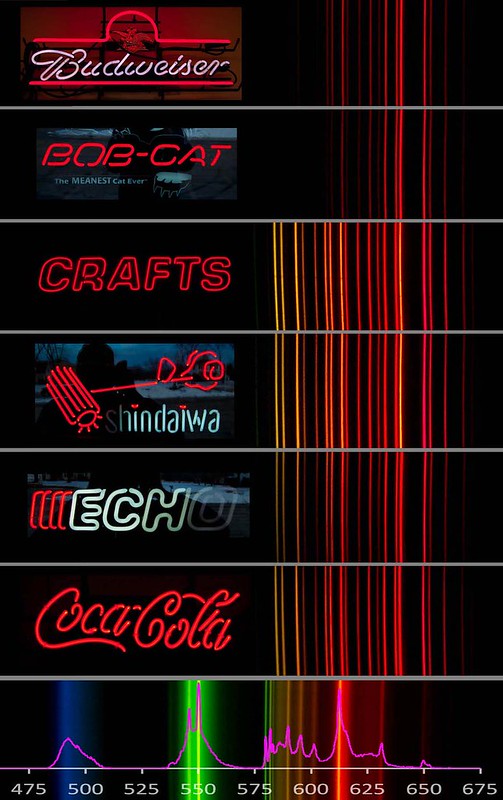
The top two spectra above (Bud and Bobcat) are dimmer than the others. Not all neon tubes are the same brightness, so to get consistent images, the exposure has to be altered for each tube. I think those two images are dimmer and missing some peaks because I set the exposure wrong, not because the pattern of emission lines was different. The pattern of varying intensities among the peaks is a characteristic of emission spectra that can be used to identify elements, but I will need better control over photographic exposure before I will be able to use that quantitatively. I was using manual exposure control because automatic exposure generally overexposes the spectra. I think bracketing exposure is called for.
1 Comments
Hi Chris, Two comments. 1) You might be overestimating Ebert's rigidity, so try deliberately stressing it to see how much change you get in the CFL spectrum. Also try removing and re-mounting the camera a few times. There could also be some geometry changes related to temperature changes.
2) Accurately measuring relative intensities of spectral lines could present a problem because of the rgb pixelation and the camera's attempt to make the scene look like what the human eye would see. Try comparing the spectrum of a black-body radiator like a tungsten light to the calculated black-body curve and you will likely see this effect. An Excel black body calculator can be found here: web.colby.edu/ch332public/files/.../Black-Body-Emission-Spectra.xls
Reply to this comment...
Log in to comment
Login to comment.