Last winter I installed an Arduino data logger next to my woodstove and logged temperature data for most of the wood burning season. An infrared sensor pointed at the stove produced an index of how hot the stove was, and the Arduino saved that temperature and some other data every five minutes. The Arduino also turned on and off the stove's internal circulation fan as a function of stove temperature.
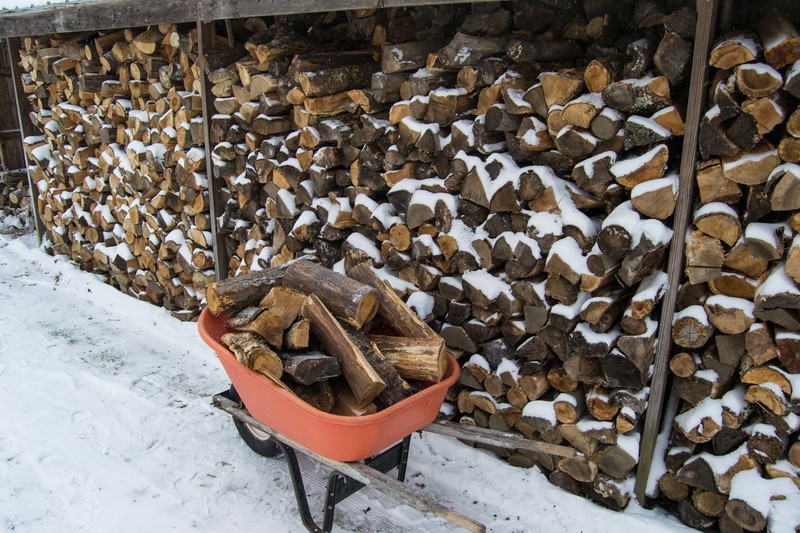
Figure 1. Firewood queued to be burned in the woodstove. The wheelbarrow holds apple (Malus pumila) wood for that day's heat. The sled holds hop hornbeam (Ostrya virginiana) wood for the next day's heat.
For 12 days in January I carefully selected the wood to be burned. Each day I burned only wood from one species of tree. The goal was to learn whether higher quality wood kept the stove hotter. I had only four different kinds of firewood: hop hornbeam, apple, red oak (Quercus rubra), and white ash (Fraxinus americana). I had enough hop hornbeam for only one day, but the other species I burned for three or four days each. I switched species at about midnight each day, so before going to bed I loaded the stove with a different type of wood and burned that species for 24 hours. Except for one case, I changed species every day.
Table 1. BTU content of firewood from six tree species. Data are million BTUs per cord of dry firewood.
| Hop Hornbeam | Apple | Red oak | White ash | Paper birch | Cottonwood |
|---|---|---|---|---|---|
| 27.3 | 26.5 | 24 | 23.6 | 20.3 | 13.5 |
The four types of firewood I burned are among the highest quality woods in Vermont (Table 1). For comparison, Table 1 includes paper birch and cottonwood, two less desirable species which I did not have in my woodpile. The different types of wood were mixed together in my wood pile and had been drying for more than a year.

Figure 2. I had to plan ahead to have enough of one type of wood ready for each day. The wheelbarrow is full of red oak.

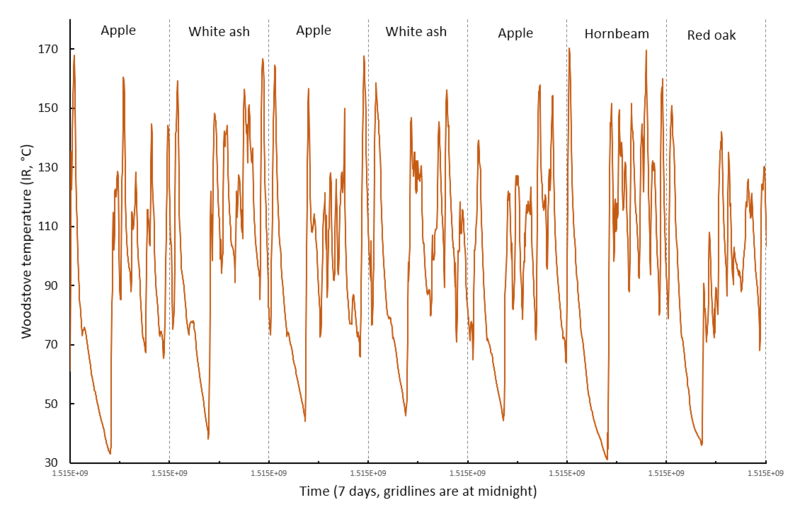
Figure 3. Temperature data from a non-contact infrared sensor pointed at the woodstove for five days in January, 2018. Different types of wood were burned on different days. The temperature rises after wood has been added to the stove and then drops until more wood is added. A long period of dropping temperature happens every night after midnight until more wood is added at 9:00 or 10:00 AM.

Figure 4. Woodstove temperature data for seven consecutive days in January, 2018.
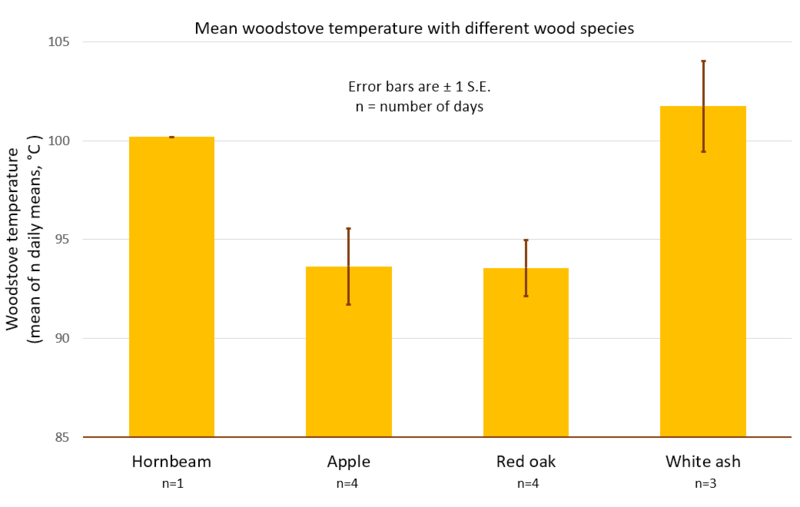
To compare the effects of the four different wood species, I averaged the temperature data for each day, so about 288 data entries (one for every five minutes) were averaged. There were three or four days for each of the species, and those days are used as replicates. There was no replication of the day when hop hornbeam was burned.

Figure 5. Mean woodstove temperature for days when each of four wood types were burned. The means and standard errors (error bars) were computed from the replicate days (n) for each wood species.
There is not a very good relationship between the known energy content of the different wood species (Table 1) and the mean temperature results (Figure 5). Although all of the wood had been dried for the same length of time, white ash dries faster than the other woods (pers. comm., the guys who bring me the firewood). So it is possible that higher moisture content of the other species reduced the amount of heat they emitted as they burned (energy has to be used to boil off the water). It is also possible that I loaded wood differently on different days. Each day, I recorded how often I loaded the stove, and how many logs I loaded each time. 
Figure 6. Means of the number of times logs were loaded into the woodstove each day (yellow) and how many logs were loaded each day (orange) for each of the four species of wood.
There is probably no difference in the total number of logs loaded each day, but it appears that white ash was loaded into the stove one or two times more often than the other species (Figure 6). This inconsistency could account for the unexpected result that white ash produced more heat than the other species--more frequent loading can maintain a higher average stove temperature.
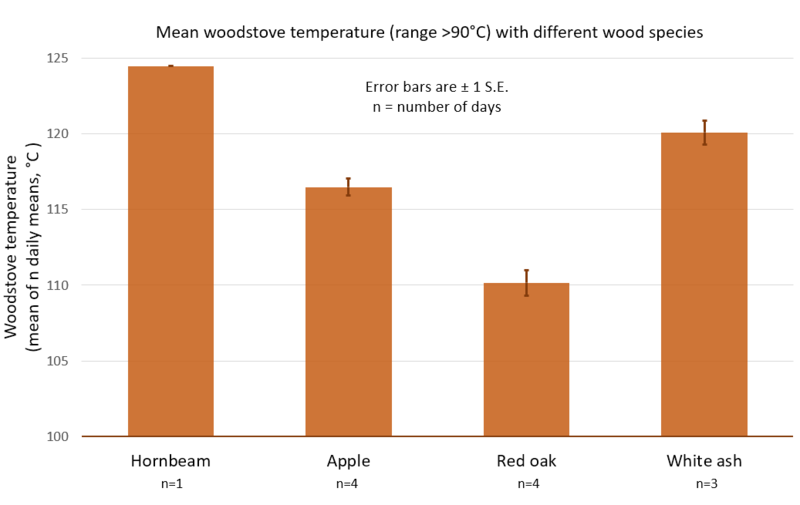
Continuing my search for possible explanations for the scientific result that did not meet my expectations, I did what all good scientists do and tried to reanalyze the data to get a result which better met my preexisting understanding.The mean daily stove temperature is influenced strongly by the nighttime period when no wood is added. Assuming that the quality of the wood will have more effect on the periods when the stove is burning hot, I truncated the dataset so it did not include times when the stove temperature was less than 90°C.

Figure 7. Mean woodstove temperature for days when each of four wood types were burned, for only the periods of each day when the stove temperature exceeded 90°C. The means and standard errors (error bars) were computed from the replicate days (n) for each wood species.
Removing the data for periods when the woodstove temperature was less than 90°C tended to improve the relationship between the known energy content of the wood (Table 1) and the woodstove temperature (Figure 7). Three of the four wood species now align with expectations, but that impertinent white ash still seems to produce more heat than the better quality wood from apple and red oak.
I now have an increased respect for white ash and will be happy to include it in my wood pile. If I ever repeat this observation, I will be sure to include some types of wood with much lower energy content like cottonwood or pine. All of the wood types I burned for this study are excellent firewood, so my failure to find clear differences among them with my crude methodology is not surprising.
Kits to build data loggers capable of collecting this type of information like the Mini Pearl Logger and the Nano Data Logger are available at the Public Lab Store and the KAPtery.

0 Comments
Login to comment.