I just built the Coqui water conductivity sensor by following the steps in this activity: Build a sound-generating Coqui conductivity sensor (new version!). It was really fun to put together and try out right away!
Building the coqui
I didn't end up using the terminal block mentioned in the parts list. And the jumper wires I had were a bit long, so my build doesn't look as neat as the one in the instructions. But it's still super cute.
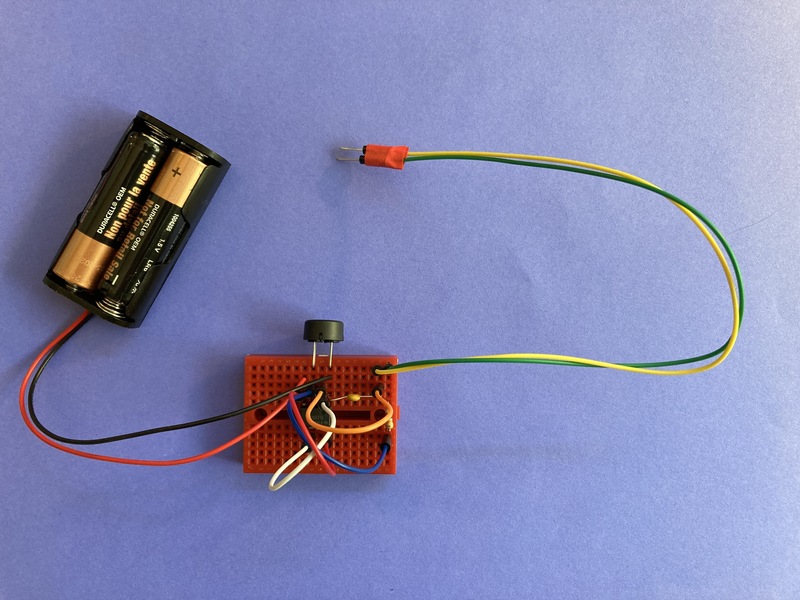
Assembled coqui water conductivity sensor.
Testing the coqui
To try to get different sounds out of the coqui, I made a couple salt water solutions that hopefully varied in conductivity (how well they conduct electric current). Using a handy silicone baby food tray, I made three test samples:
- Plain cold tap water (2 tbs)
- Slightly salty water (0.1 g salt/ml = 0.5 tsp salt in 2 tbs cold water)
- More salty water (0.2 g salt/ml = 1 tsp salt in 2 tbs cold water)

Solutions with different concentrations of salt for testing the coqui.
When I dipped the probe wires into the different solutions, I did notice a difference in the buzzing sounds produced by the plain water versus the two salt solutions! 🔉🎉 The salt solutions sounded louder and higher pitched (higher frequency). I couldn't really tell the difference between the two salt solutions with just my ears, though.
Analyzing the coqui's sound
I wanted to analyze the sound further, so I followed the guidance in this neat activity by @imvec: Analyzing the signal of the Coqui using Audacity. I recorded the coqui's sounds for each test solution with my laptop microphone, nothing fancy (though I did realize I should move my analog desk clock after seeing the ticks appear on the recording). I tried to keep the probe wires as still as possible. My frequency analysis plots ended up looking like this:

Coqui's response to plain tap water. The horizontal axis shows sound frequency (pitch) and the vertical axis shows sound level (loudness).
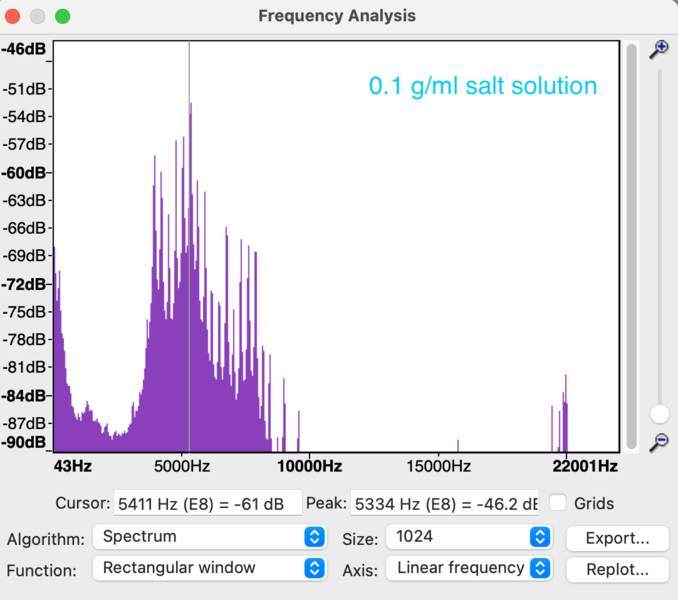
Coqui's response to a 0.1 g/ml salt solution. The horizontal axis shows sound frequency (pitch) and the vertical axis shows sound level (loudness).
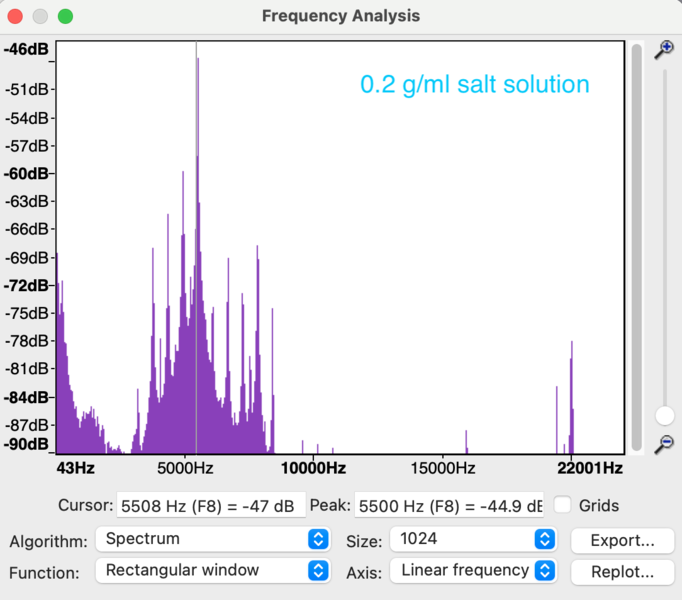
Coqui's response to a 0.2 g/ml salt solution. The horizontal axis shows sound frequency (pitch) and the vertical axis shows sound level (loudness).
Hard to tell major differences in the frequency histogram! (histogram = bar graph showing the distribution of frequencies along the horizontal axis.) There's a good bit of noise.
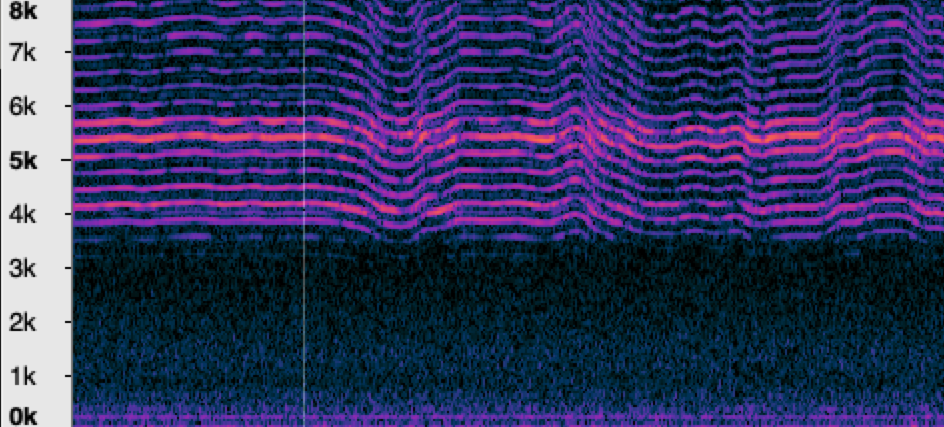
The spectrogram (below) showing frequency versus time is interesting! Brighter colors indicate higher sound levels. Not entirely sure what to make of this. You can see where I was moving the coqui probes in the wiggly parts of the plain water spectrogram at the top.

Spectrograms of sound signals produced by the coqui in different test solutions. Top = plain water, middle = 0.1 g/ml salt solution, bottom = 0.2 g/ml salt solution. The vertical axis is frequency (pitch) in hertz, the horizontal axis is time, and the brighter colors indicate sound level (loudness).
Listening to the recordings playing back from my desktop speakers, it was harder to tell a difference between test solutions. Maybe the laptop mic wasn't picking up signal differences very well? Or maybe my ears heard what they expected to hear when I originally tested the salt solutions? 🤷🏻♀️
I thought that distilling this down further and just calculating an average frequency for each test solution might help show differences (or lack thereof). I exported the frequency data from Audacity, which produced two columns of data: frequency in hertz (Hz) and level in decibels (dB). Then I calculated the average frequency for each solution's whole sound signal, weighted by signal amplitude. I got amplitude by converting decibel output back with 10dB/20.
Average frequency weighted by amplitude:
- Plain tap water: 5820 Hz
- 0.1 g/ml salt solution: 5900 Hz
- 0.2 g/ml salt solution: 6190 Hz
According to this National Institutes of Health publication, the human ear is capable of noticing these differences in pitch.
The coqui build and recordings and analysis were all pretty fun to do. I'm hoping to keep experimenting with different solutions, and maybe a more controlled sound environment.
0 Comments
Login to comment.