What I want to do
I want a simple graphic user interface (GUI) to log data with Arduino / LaunchPad type microcontroller boards.
My attempt and results
To start, you need data to log. Since I want to log data from analog sensors, I wrote a quick Energia sketch for a LaunchPad that ramps a pwm output up then down and then turns off (this code and the code for the GUI are at https://github.com/SmokyMountainScientific/DataLogger). The pwm output on pin 1.6 is turned into an analog signal using a resister and capacitor and is read on pin 1.0 (as shown below).
 That was pretty easy. The sketch waits for a command from the serial comm port and then ramps voltage up and down, reading the output and logging the data to the serial port. The GUI is a little more complicated and I still dont have it running exactly the way I want it. The GUI was written in Processing and is mostly derived from code written by Ben Hickman for our potentiostat project. There is a problem, however, in that newer versions of Processing software are not compatible with some of the libraries used in the GUI and I have not yet figured out how to make the data display in real time.
So here is what is working:
Com port selection works well. There is a dropdown list that allows you to select the com port that your board is on. The figure below shows the GUI as it comes up, but with the dropdown list pulled down. Once you select a comport and click on the connect button, you can start your experiment by clicking on the start run button.
That was pretty easy. The sketch waits for a command from the serial comm port and then ramps voltage up and down, reading the output and logging the data to the serial port. The GUI is a little more complicated and I still dont have it running exactly the way I want it. The GUI was written in Processing and is mostly derived from code written by Ben Hickman for our potentiostat project. There is a problem, however, in that newer versions of Processing software are not compatible with some of the libraries used in the GUI and I have not yet figured out how to make the data display in real time.
So here is what is working:
Com port selection works well. There is a dropdown list that allows you to select the com port that your board is on. The figure below shows the GUI as it comes up, but with the dropdown list pulled down. Once you select a comport and click on the connect button, you can start your experiment by clicking on the start run button.
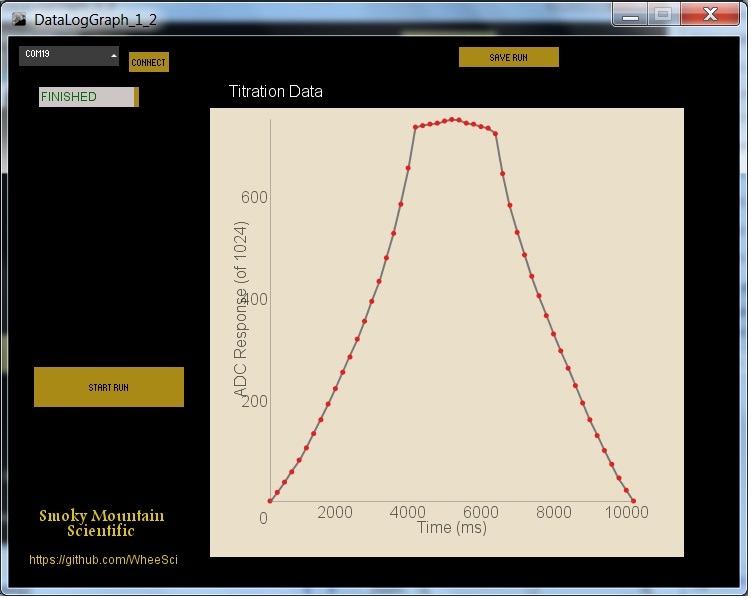
 After the run is over, a graph of the data is displayed, as shown in the main image. The data can be written to a file on your computer by clicking the save run button and specifying a path and file name once a dialog box pops up.
As I said earlier, though, I have not yet figured out how to make the graph update during the experiment.
After the run is over, a graph of the data is displayed, as shown in the main image. The data can be written to a file on your computer by clicking the save run button and specifying a path and file name once a dialog box pops up.
As I said earlier, though, I have not yet figured out how to make the graph update during the experiment.
Questions and next steps
I need to figure out how to get the graph to update in real time. The source code is available at the GitHub site and any recommendations as to how to fix this would be gratefully appreciated. The problem is in the program DataLogGraph_1_2/DataLogGraph_1_2.pde. There is a "lineChart.draw" command at line 225 that is supposed to update the graph in real time but does not do anything. At the end of the file (line 239), there is another "lineChart.draw" command that displays the data after the experiment is finished. If I move the latter command up one line the graph fails to display. That move puts it into a loop started at line 256:
if (run == true) {
Once we have this issue settled, my plan is to merge the data logging GUI with our syringe pump control GUI. At that point, it will be pretty simple to incorporate the pH electrode amplifier (figure below) to do automated titrations.

3 Comments
Hi Folks, Thanks to Ben and Craig, the code on the GitHub site (https://github.com/SmokyMountainScientific/DataLogger) has been cleaned up and it now updates the graph in real time. Please feel free to use this as a resource when writing GUIs for your own projects. Jack.
Reply to this comment...
Log in to comment
Hi, Jack - this was a while ago, but lots has changed in some of these technologies. I was wondering if you'd considered using something like WebJack to easily offload data from an arduino-compatible board (these are super cheap now, like some on the data logging page).
Reply to this comment...
Log in to comment
Hi Jeff, I was not aware of these technologies. Thanks for bringing them to my attention. Jack
Reply to this comment...
Log in to comment
Login to comment.