We wanted to use our thermal flashlight to locate outdoor spaces which offered a significant increase in temperature. That is, we would be using it to measure changes in temperature, rather than just measure a constant. As such, we intended to calibrate our thermal flashlight depending on the current ambient temperature and measure significant temperatures increases above that. However, we recognized that depending on the current temperature, outdoor spaces, such as heat vents or shelters, might not offer a constant increase in temperature—i.e. the same heat vent would be unlikely to increase the temperature by 10 C in both 0 C and -10 C weather. We therefore had to anticipate what possible increase in temperature could be offered by a hot spot that would also be a significant increase in temperature. We developed a function to operationalize this idea.
Our function is based on climate statistics and previous fieldwork. We determined that a hotspot would be designated according to a significant increase in temperature as it is possible within the extreme high and low temperatures in St. John's, Newfoundland, during the month of December. Since temperatures fluctuate commonly in St. John’s, we had to consider a wide range of temperature changes. We thus developed the following piecewise function, where OT is the outside temperature, and SI is a significant increase:

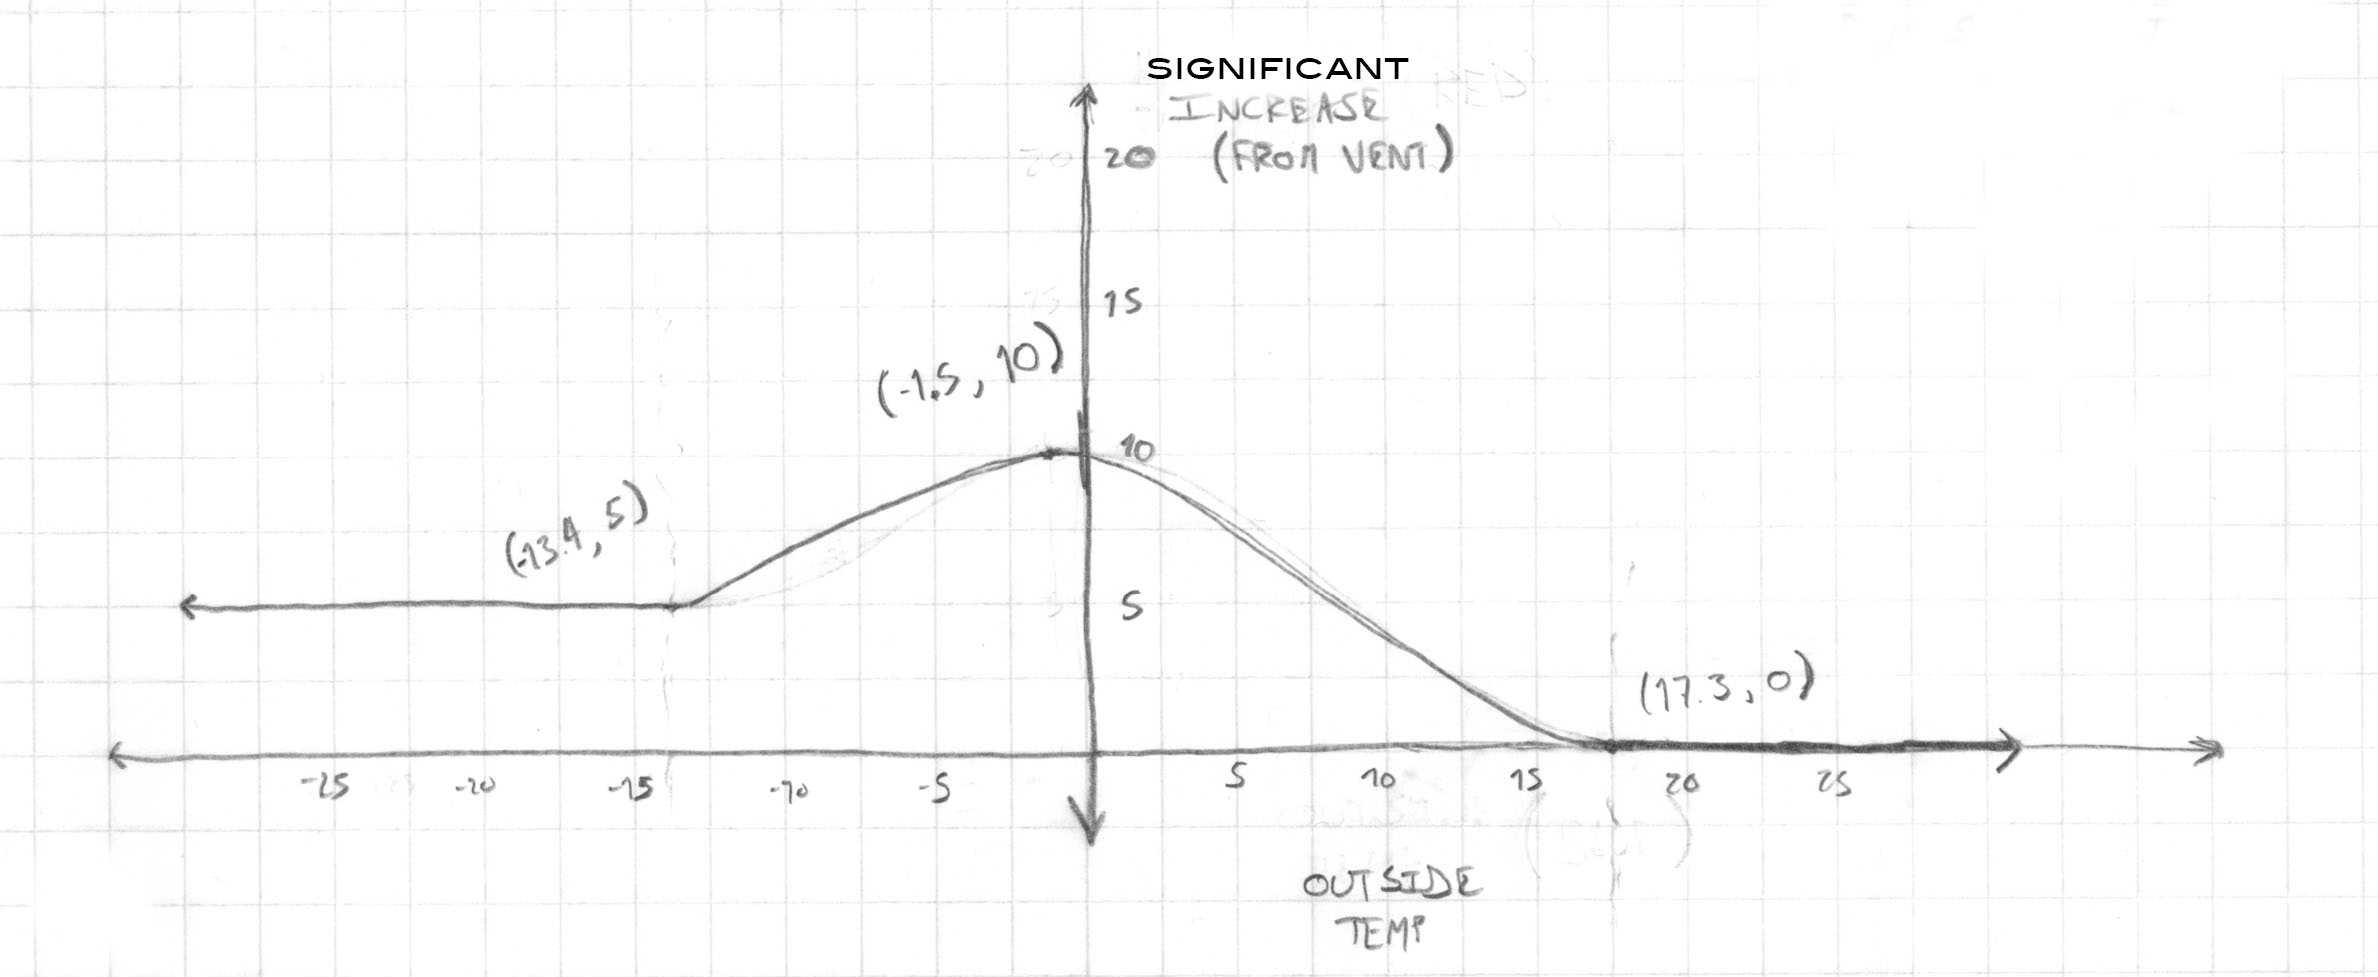
A hotspot would thereby be designated by any area offering a temperature increase at or above the ‘significant increase.’ The sub-functions are derived from the assumptions that (1) below the average extreme minimum temperature of -13.4 C, a significant increase in temperature would likely be no more than 5 C, that (2) any space which offers a 10 C increase when the ambient temperature is equal to the average daily temperature of -1.5 C is worth documenting, but the increase offered by this space will likely be less as the outside temperature is farther from -1.5 C, and that (3) no significant increase in temperatures is likely above the extreme maximum temperature of 17.3 C. This formula can be visualized using the following graph:

Accordingly, we would measure the outdoor temperature, use the formula to determine what significant increase in temperature would designate a hotspot on that given day and thereby calibrate our thermal flashlight according to the following:

0 Comments
Login to comment.